
קובץ:20210822 Global warming - warming stripes bar chart.svg

לקובץ המקורי (קובץ SVG, הגודל המקורי: 1,000 × 750 פיקסלים, גודל הקובץ: 14 ק"ב)
| זהו קובץ שמקורו במיזם ויקישיתוף. תיאורו בדף תיאור הקובץ המקורי (בעברית) מוצג למטה. |
תקציר
| תיאור |
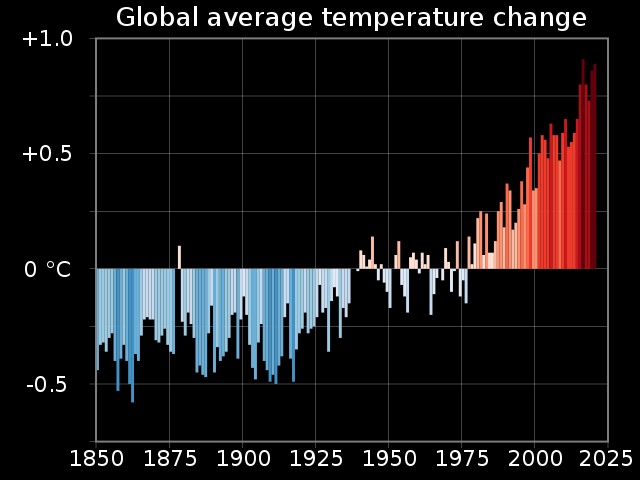
English: Vertical bar chart showing global average temperature change, with each bar/column being coloured according to the Warming stripes colouring scheme of Ed Hawkins (climatologist, who conceived the idea of warming stripes.
 Warming stripes (five examples compared) Warming stripes bar chart Bar chart (vertical) Pie chart Line charts Scatterplot I've uploaded .xlsx (Microsoft Excel) spreadsheets that automatically generate XML code for charts in SVG format. You simply paste or enter your data into the spreadsheet, and specify image dimensions, number of grid lines, font sizes, etc. The spreadsheet instantly and automatically generates a column of XML code that you simply copy and paste into a text editor and save as an ".svg" file. The spreadsheets produce lean SVG code, avoiding the "extra stuff" that Inkscape inserts. They should save you time in creating SVG charts. Feedback and suggestions on my talk page are welcome. RCraig09 (שיחה) 23:41, 19 February 2021 (UTC) Click HOW TO for detailed explanation.
Example SVG files: Category:SVG diagrams created with spreadsheet.
|
| תאריך יצירה | |
| מקור | נוצר על־ידי מעלה היצירה |
| יוצר | RCraig09 |
| SVGהתפתחות | Other tools עם נוצרה ה גרפיקה וקטורית |


רישיון
- הנכם רשאים:
- לשתף – להעתיק, להפיץ ולהעביר את העבודה
- לערבב בין עבודות – להתאים את העבודה
- תחת התנאים הבאים:
- ייחוס – יש לתת ייחוס הולם, לתת קישור לרישיון, ולציין אם נעשו שינויים. אפשר לעשות את זה בכל צורה סבירה, אבל לא בשום צורה שמשתמע ממנה שמעניק הרישיון תומך בך או בשימוש שלך.
- שיתוף זהה – אם תיצרו רמיקס, תשנו, או תבנו על החומר, חובה עליכם להפיץ את התרומות שלך לפי תנאי רישיון זהה או תואם למקור.
היסטוריית הקובץ
ניתן ללחוץ על תאריך/שעה כדי לראות את הקובץ כפי שנראה באותו זמן.
| תאריך/שעה | תמונה ממוזערת | ממדים | משתמש | הערה | |
|---|---|---|---|---|---|
| נוכחית | 23:41, 8 באוגוסט 2022 | | 750 × 1,000 (14 ק"ב) | Sebastian Wallroth | File uploaded using svgtranslate tool (https://svgtranslate.toolforge.org/). Added translation for de. |
| 23:28, 23 באוגוסט 2021 |  | 750 × 1,000 (12 ק"ב) | RCraig09 | Version 2: narrowing vertical scale so trace occupies more of image | |
| 07:03, 23 באוגוסט 2021 |  | 750 × 1,000 (13 ק"ב) | RCraig09 | Uploaded own work with UploadWizard |
שימוש בקובץ
הדף הבא משתמש בקובץ הזה:
שימוש גלובלי בקובץ
אתרי הוויקי השונים הבאים משתמשים בקובץ זה:
- שימוש באתר en.wikipedia.org
- Talk:SVG
- Wikipedia:SVG help
- Talk:Data and information visualization
- User talk:RCraig09
- Warming stripes
- Talk:Warming stripes
- Wikipedia talk:WikiProject Countries/Archive 13
- Wikipedia talk:WikiProject Climate change/Archive 2
- Talk:Climate change/Archive 86
- User:RCraig09/Excel to XML for SVG
- User talk:RCraig09/Archive 2 (2020)
- Wikipedia:Graphics Lab/Illustration workshop/Archive/Apr 2021
- Passive daytime radiative cooling
- User talk:RCraig09/Archive 3 (2021-2022)
- User talk:RCraig09/Archive 4 (2023)
- שימוש באתר gl.wikipedia.org