
קובץ:Global warming hiatus.gif
אין גרסה ברזולוציה גבוהה יותר.
Global_warming_hiatus.gif (509 × 370 פיקסלים, גודל הקובץ: 500 ק"ב, סוג MIME: image/gif, בלולאה, 42 תמונות, 18 שניות)
| זהו קובץ שמקורו במיזם ויקישיתוף. תיאורו בדף תיאור הקובץ המקורי (בעברית) מוצג למטה. |
תקציר
| תיאור |
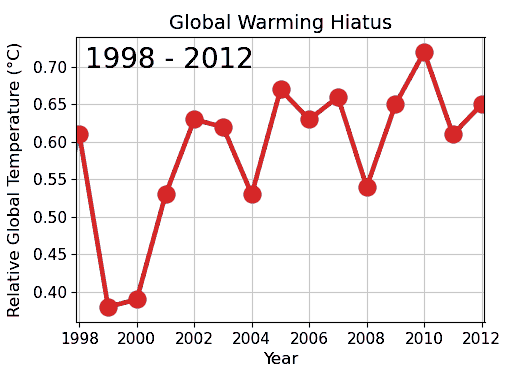
English: By selecting or cherry-picking data, the trend of global warming appears to mistakenly stop, as in the period from 1998 to 2012, which is actually a random contrary fluctuation. |
| תאריך יצירה | |
| מקור | נוצר על־ידי מעלה היצירה |
| יוצר | Physikinger |
| גרסאות אחרות | German version File:Vermeindlicher Stillstand der globalen Erwaermung.gif |
| GIFהתפתחות | Matplotlib עם נוצרה ה GIF תמונת מפת סיביות |
| קוד מקור | Python code# This source code is public domain
import numpy
import matplotlib.pyplot as plt
import imageio
year_T = {
# https://data.giss.nasa.gov/gistemp/tabledata_v4/GLB.Ts+dSST.txt
# GLOBAL Land-Ocean Temperature Index in 0.01 degrees Celsius base period: 1951-1980
# sources: GHCN-v4 1880-07/2021 + SST: ERSST v5 1880-07/2021
# using elimination of outliers and homogeneity adjustment
# Divide by 100 to get changes in degrees Celsius (deg-C).
# Year J-D (annual mean Temperature Jan to Dec)
1880: -16, 1881: -8, 1882: -11, 1883: -17, 1884: -28,
1885: -33, 1886: -31, 1887: -36, 1888: -17, 1889: -10,
1890: -35, 1891: -22, 1892: -27, 1893: -31, 1894: -30,
1895: -22, 1896: -11, 1897: -11, 1898: -27, 1899: -17,
1900: -8, 1901: -15, 1902: -28, 1903: -37, 1904: -47,
1905: -26, 1906: -22, 1907: -38, 1908: -43, 1909: -48,
1910: -43, 1911: -44, 1912: -36, 1913: -34, 1914: -15,
1915: -14, 1916: -36, 1917: -46, 1918: -30, 1919: -28,
1920: -27, 1921: -19, 1922: -29, 1923: -27, 1924: -27,
1925: -22, 1926: -11, 1927: -22, 1928: -20, 1929: -36,
1930: -16, 1931: -9, 1932: -16, 1933: -29, 1934: -13,
1935: -20, 1936: -15, 1937: -3, 1938: 0, 1939: -2,
1940: 13, 1941: 19, 1942: 7, 1943: 9, 1944: 20,
1945: 9, 1946: -7, 1947: -3, 1948: -11, 1949: -11,
1950: -17, 1951: -7, 1952: 1, 1953: 8, 1954: -13,
1955: -14, 1956: -19, 1957: 5, 1958: 6, 1959: 3,
1960: -3, 1961: 6, 1962: 3, 1963: 5, 1964: -20,
1965: -11, 1966: -6, 1967: -2, 1968: -8, 1969: 5,
1970: 3, 1971: -8, 1972: 1, 1973: 16, 1974: -7,
1975: -1, 1976: -10, 1977: 18, 1978: 7, 1979: 16,
1980: 26, 1981: 32, 1982: 14, 1983: 31, 1984: 16,
1985: 12, 1986: 18, 1987: 32, 1988: 39, 1989: 27,
1990: 45, 1991: 40, 1992: 22, 1993: 23, 1994: 31,
1995: 45, 1996: 33, 1997: 46, 1998: 61, 1999: 38,
2000: 39, 2001: 53, 2002: 63, 2003: 62, 2004: 53,
2005: 67, 2006: 63, 2007: 66, 2008: 54, 2009: 65,
2010: 72, 2011: 61, 2012: 65, 2013: 67, 2014: 74,
2015: 90, 2016: 101, 2017: 92, 2018: 85, 2019: 97,
2020: 102, 2021: 85, 2022: 89,
}
x, y = (numpy.array(list(x()), dtype='d') for x in (year_T.keys, year_T.values))
y = y / 100
xMinFocus, xMaxFocus = 1998, 2012
i0 = x.tolist().index(xMinFocus)
i1 = x.tolist().index(xMaxFocus) + 1
nPoly = 4
phi = numpy.array([x**i for i in range(nPoly)])
A = phi @ phi.T
b = phi @ y
c = numpy.linalg.solve(A, b)
yPoly = c @ phi
phiHist = phi[:,:i1]
A = phiHist @ phiHist.T
b = phiHist @ y[:i1]
c = numpy.linalg.solve(A, b)
yPolyHist = c @ phi
nPoly = 3
phiF = phi[:nPoly,i0:i1]
A = phiF @ phiF.T
b = phiF @ y[i0:i1]
c = numpy.linalg.solve(A, b)
yPolyFocus = c @ phi[:nPoly]
yMinTotal, yMaxTotal = numpy.min(y) - 0.02, numpy.max(y) + 0.02
xMinTotal, xMaxTotal = numpy.min(x), numpy.max(x)
yMinFocus, yMaxFocus = numpy.min(y[i0:i1]) - 0.02, numpy.max(y[i0:i1]) + 0.02
plt.xlim(xMinFocus-0.1, xMaxFocus+0.1)
# Frame-Parameter:
# t: Frame duration
# trans1: transition 0 to 1 towards full time frame
# trans2: transition 0 to 1 towards full data set
# showTrend: Trend (0: None, 1: Zoom, 2: full history, 3: full time frame)
parameters = [ # (t, trans1, trans2, showTrend)
(1, 0.0, 0.0, 0),
(4, 0.0, 0.0, 1),
*[(0.1, t**2, 0.0, 1) for t in numpy.linspace(0,1,25)],
(1.0, 1.0, 0.0, 1),
(0.5, 1.0, 0.0, 0),
(1, 1.0, 0.0, 2),
*[(0.1, 1.0, t,2) for t in numpy.linspace(0,1,10)],
(0.5, 1.0, 1.0, 2),
(6, 1.0, 1.0, 3),
]
images = []
duration = []
for t, trans1, trans2, showTrend in parameters:
duration.append(t)
zoom = 4*(1-trans1) + 1*trans1
fig = plt.figure(figsize=(5.1,3.7), dpi=100)
plt.rc('axes', titlesize=14, labelsize=12)
plt.rc('xtick', labelsize=11)
plt.rc('ytick', labelsize=11)
plt.rc('legend', fontsize=16)
if showTrend == 1: plt.plot(x[i0-15:], yPolyFocus[i0-15:], 'r--', label='Trend')
if showTrend == 2: plt.plot(x, yPolyHist, 'b--', label='Trend')
if showTrend == 3: plt.plot(x, yPoly, 'b--', label='Trend')
iMax = int(i1 + trans2*(len(x)-i1))
plt.plot(x[:iMax], y[:iMax], 'C0.-', alpha=0.8, linewidth=0.8*zoom, markersize=6*zoom)
plt.plot(x[i0:i1], y[i0:i1], 'C3.-', linewidth=0.805*zoom, markersize=6.05*zoom)
plt.grid(True, alpha=0.7)
yMax = yMaxFocus + trans1*(yMaxTotal-yMaxFocus)
xMax = xMaxFocus + trans1*(xMaxTotal-xMaxFocus)
xMin = xMinFocus*(1-trans1) + xMinTotal*trans1
plt.xlim(xMin-0.1, xMax+0.1+1*trans1)
plt.ylim(yMinFocus*(1-trans1) + yMinTotal*trans1, yMaxFocus*(1-trans1) + yMax*trans1+0.03*trans1)
plt.text(0.02, 0.89, '%i - %i'%(xMin, x[iMax-1]), transform=plt.gca().transAxes, fontsize=20)
plt.title('Global Warming Hiatus')
plt.xlabel('Year')
plt.ylabel('Relative Global Temperature (°C)')
plt.gca().yaxis.set_label_coords(-0.13, 0.5)
if showTrend: leg = plt.legend(frameon=False, loc='lower right')
fig.subplots_adjust(
top=0.9,
bottom=0.13,
left=0.15,
right=0.95,
hspace=0.2,
wspace=0.2
)
fig.canvas.draw()
s, (width, height) = fig.canvas.print_to_buffer()
images.append(numpy.array(list(s), numpy.uint8).reshape((height, width, 4)))
fig.clf()
plt.close('all')
# Save GIF animation
fileOut = 'Global_warming_hiatus.gif'
imageio.mimsave(fileOut, images, duration=duration)
# Optimize GIF size
from pygifsicle import optimize
optimize(fileOut, colors=20)
|
רישיון
אני, בעל זכויות היוצרים על עבודה זו, מפרסם בזאת את העבודה תחת הרישיון הבא:
| קובץ זה זמין לפי תנאי הקדשה עולמית לנחלת הכלל CC0 1.0 של Creative Commons. | |
| האדם ששייך יצירה להיתר הזה הקדיש את היצירה לנחלת הכלל על־ידי ויתור על כל הזכויות שלו או שלה על היצירה בכל העולם לפי חוק זכויות יוצרים, לרבות כל הזכויות הקשורות או הסמוכות כקבוע בחוק. באפשרותך להעתיק, לשנות, להפיץ, או להציג את היצירה, אפילו למטרות מסחריות, וכל זה אפילו מבלי לבקש רשות.
|
היסטוריית הקובץ
ניתן ללחוץ על תאריך/שעה כדי לראות את הקובץ כפי שנראה באותו זמן.
| תאריך/שעה | תמונה ממוזערת | ממדים | משתמש | הערה | |
|---|---|---|---|---|---|
| נוכחית | 23:52, 17 באפריל 2023 | | 370 × 509 (500 ק"ב) | Physikinger | Shorter red line |
| 21:36, 13 באפריל 2023 |  | 370 × 509 (511 ק"ב) | Physikinger | Extrapolation, Timing | |
| 00:01, 13 באפריל 2023 |  | 370 × 509 (510 ק"ב) | Physikinger | Update 2022, single zoom transition | |
| 15:37, 7 בספטמבר 2021 |  | 370 × 509 (511 ק"ב) | Physikinger | Smaller file size | |
| 01:09, 7 בספטמבר 2021 |  | 370 × 509 (617 ק"ב) | Physikinger | Fixed label, less colors | |
| 22:01, 1 בספטמבר 2021 |  | 370 × 509 (884 ק"ב) | Physikinger | Uploaded own work with UploadWizard |
שימוש בקובץ
הדף הבא משתמש בקובץ הזה:
שימוש גלובלי בקובץ
אתרי הוויקי השונים הבאים משתמשים בקובץ זה:
- שימוש באתר azb.wikipedia.org
- שימוש באתר bg.wikipedia.org
- שימוש באתר da.wikipedia.org
- שימוש באתר en.wikipedia.org
- שימוש באתר fr.wikipedia.org
- שימוש באתר id.wikipedia.org
- שימוש באתר it.wikipedia.org
- שימוש באתר ja.wikipedia.org
- שימוש באתר uk.wikipedia.org
- שימוש באתר www.wikidata.org
- שימוש באתר zh.wikipedia.org