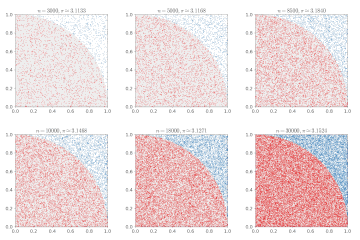
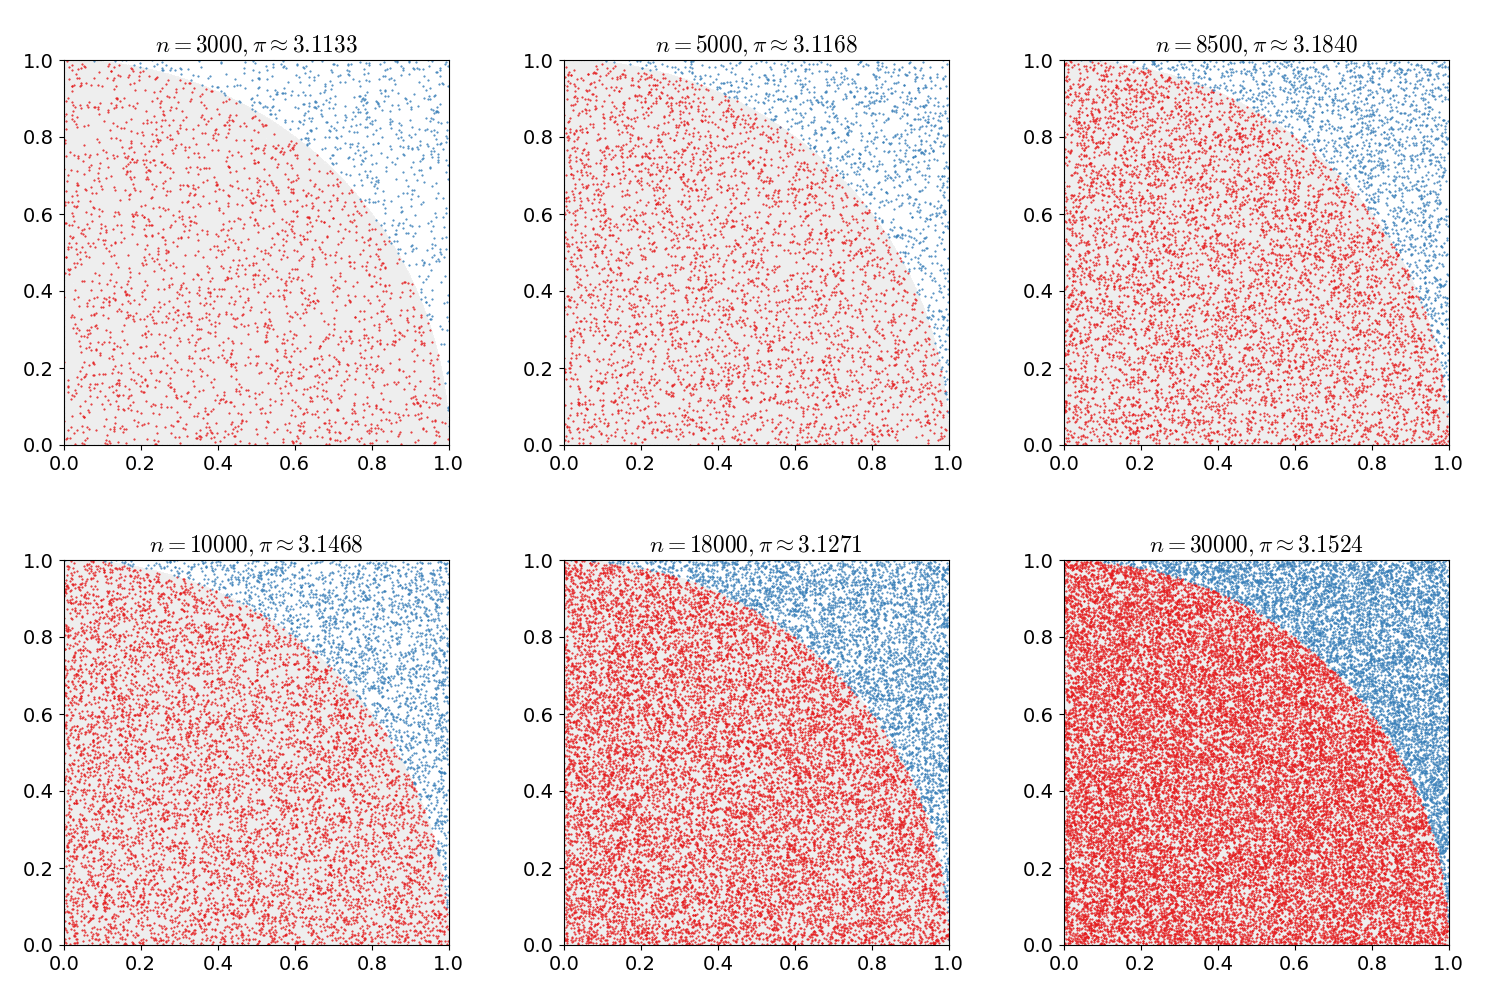
קובץ:Pi 30K.gif
Pi_30K.gif (500 × 500 פיקסלים, גודל הקובץ: 476 ק"ב, סוג MIME: image/gif, בלולאה, 10 תמונות, 2.0 שניות)
היסטוריית הקובץ
ניתן ללחוץ על תאריך/שעה כדי לראות את הקובץ כפי שנראה באותו זמן.
| תאריך/שעה | תמונה ממוזערת | ממדים | משתמש | הערה | |
|---|---|---|---|---|---|
| נוכחית | 19:00, 16 בפברואר 2017 |  | 500 × 500 (476 ק"ב) | Nicoguaro | Make the plot square and increase gif delay. |
| 18:38, 16 בפברואר 2017 |  | 480 × 640 (476 ק"ב) | Nicoguaro | Bigger text in the axes, and colors from ColorBrewer. Code in Python. | |
| 21:29, 7 בנובמבר 2011 |  | 500 × 500 (373 ק"ב) | Rayhem | Slowed animation to avoid looking like a blinky page element, improved resolution, added counter for number of points, shaded points inside/outside the circle. ==Mathematica 7.0 Source== <pre> tinyColor[color_, point_] := {PointSize[Small], color, Point[ | |
| 02:12, 15 במרץ 2011 |  | 369 × 360 (363 ק"ב) | CaitlinJo | {{Information |Description ={{en|1=As points are randomly scattered inside the unit square, some fall within the unit circle. The fraction of points inside the circle over all points approaches pi as the number of points goes toward infinity. This ani |
שימוש בקובץ
הדף הבא משתמש בקובץ הזה:
שימוש גלובלי בקובץ
אתרי הוויקי השונים הבאים משתמשים בקובץ זה:
- שימוש באתר ar.wikipedia.org
- שימוש באתר be.wikipedia.org
- שימוש באתר bg.wikipedia.org
- שימוש באתר ca.wikipedia.org
- שימוש באתר da.wikipedia.org
- שימוש באתר el.wikipedia.org
- שימוש באתר en.wikipedia.org
- שימוש באתר en.wikibooks.org
- שימוש באתר eo.wikipedia.org
- שימוש באתר eu.wikipedia.org
- שימוש באתר fa.wikipedia.org
- שימוש באתר fr.wikipedia.org
- שימוש באתר hi.wikipedia.org
- שימוש באתר id.wikipedia.org
- שימוש באתר it.wikipedia.org
- שימוש באתר ja.wikipedia.org
- שימוש באתר ko.wikipedia.org
- שימוש באתר pt.wikipedia.org
- שימוש באתר sh.wikipedia.org
- שימוש באתר simple.wikipedia.org
- שימוש באתר sl.wikipedia.org
- שימוש באתר sr.wikipedia.org
- שימוש באתר sv.wikipedia.org
- שימוש באתר ta.wikipedia.org
- שימוש באתר test.wikipedia.org
- שימוש באתר tr.wikipedia.org
- שימוש באתר uk.wikipedia.org
- שימוש באתר vi.wikipedia.org
- שימוש באתר www.wikidata.org
- שימוש באתר zh-yue.wikipedia.org
- שימוש באתר zh.wikipedia.org

