
קובץ:Sinc function (both).svg

גודל התצוגה המקדימה הזאת מסוג PNG של קובץ ה־SVG הזה: 800 × 600 פיקסלים. רזולוציות אחרות: 320 × 240 פיקסלים | 640 × 480 פיקסלים | 1,024 × 768 פיקסלים | 1,280 × 960 פיקסלים | 2,560 × 1,920 פיקסלים | 1,300 × 975 פיקסלים.
לקובץ המקורי (קובץ SVG, הגודל המקורי: 1,300 × 975 פיקסלים, גודל הקובץ: 42 ק"ב)
| זהו קובץ שמקורו במיזם ויקישיתוף. תיאורו בדף תיאור הקובץ המקורי (בעברית) מוצג למטה. |
תקציר
| תיאור |
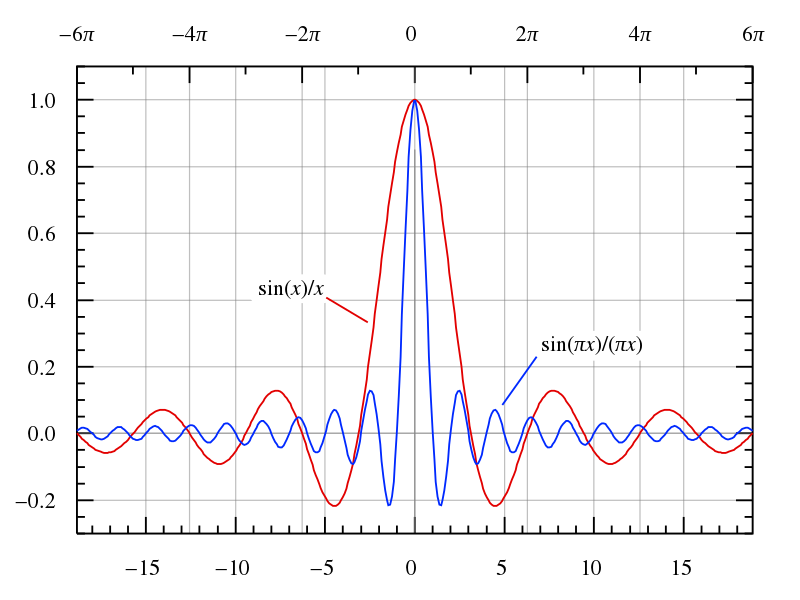
English: Graph of both the normalized (sin(πx)/(πx)) and unnormalized (sin(x)/x) definitions of the sinc function.
These are on the same scale. The second axis is just to clarify that the zero crossings occur on multiples of pi instead of integers. Instructions: |
| תאריך יצירה | 3 ביוני 2006 (תאריך העלאה) |
| מקור | נוצר על־ידי מעלה היצירה |
| יוצר | Omegatron |
| גרסאות אחרות |
|
| SVGהתפתחות | Inkscape עם נוצרה ה W3C-לא תקין גרפיקה וקטורית This file uses embedded text that can be easily translated using a text editor. |
| gnuplot source | click to expand
# Set 1300×975 SVG output and filename
# The font size (fsize) sets the size for the circles, too.
set samples 400
set terminal svg enhanced size 1300 975 fname "Times" fsize 36
set output "sinc function (both).svg"

# Set y axis limits so the plot doesn't go right to the edges of the graph
set yrange [-0.3:1.1]
set xrange [-6*pi:6*pi]

set lmargin 5
set bmargin -10

# No legend needed
#set nokey

# Add lightly-colored axis lines
set yzeroaxis
set xzeroaxis

# Put a y-axis tic at every 0.2
set ytics 0.2
set mytics 4

# Put an x-axis tic at every integer
set xtics 5
set format x "%2.0f"
set mxtics 5

# Put a second x-axis tic at every multiple of 2*pi

set x2tics 2*pi
set format x2 "%2.0f"
set mx2tics 2
set grid x x2 y
set xtics nomirror

# Format tics as digit with one decimal place
set format y "%2.1f"

# Plot as lines
plot sin(x)/x with lines, sin(pi*x)/(pi*x) with lines

# Close the file (so I don't have to close gnuplot to view it)
set output
|
.svg)
.svg)
.svg)
.svg)
.svg?uselang=he)
רישיון
אני, בעל זכויות היוצרים על היצירה הזאת, מפרסם אותה בזאת תחת הרישיונות הבאים:
הקובץ הזה מתפרסם לפי תנאי רישיונות קריאייטיב קומונז ייחוס-שיתוף זהה 3.0 לא מותאם, 2.5 כללי, 2.0 כללי ו־1.0 כללי.
- הנכם רשאים:
- לשתף – להעתיק, להפיץ ולהעביר את העבודה
- לערבב בין עבודות – להתאים את העבודה
- תחת התנאים הבאים:
- ייחוס – יש לתת ייחוס הולם, לתת קישור לרישיון, ולציין אם נעשו שינויים. אפשר לעשות את זה בכל צורה סבירה, אבל לא בשום צורה שמשתמע ממנה שמעניק הרישיון תומך בך או בשימוש שלך.
- שיתוף זהה – אם תיצרו רמיקס, תשנו, או תבנו על החומר, חובה עליכם להפיץ את התרומות שלך לפי תנאי רישיון זהה או תואם למקור.

|
מוענקת בכך הרשות להעתיק, להפיץ או לשנות את המסמך הזה, לפי תנאי הרישיון לשימוש חופשי במסמכים של גנו, גרסה 1.2 או כל גרסה מאוחרת יותר שתפורסם על־ידי המוסד לתוכנה חופשית; ללא פרקים קבועים, ללא טקסט עטיפה קדמית וללא טקסט עטיפה אחורית. עותק של הרישיון כלול בפרק שכותרתו הרישיון לשימוש חופשי במסמכים של גנו. |
הנכם מוזמנים לבחור את הרישיון הרצוי בעיניכם.
היסטוריית הקובץ
ניתן ללחוץ על תאריך/שעה כדי לראות את הקובץ כפי שנראה באותו זמן.
| תאריך/שעה | תמונה ממוזערת | ממדים | משתמש | הערה | |
|---|---|---|---|---|---|
| נוכחית | 20:12, 24 במרץ 2020 | | 975 × 1,300 (42 ק"ב) | AkanoToE | Italicized variables |
| 21:08, 3 ביוני 2006 |  | 975 × 1,300 (42 ק"ב) | Omegatron |
שימוש בקובץ
הדף הבא משתמש בקובץ הזה:
שימוש גלובלי בקובץ
אתרי הוויקי השונים הבאים משתמשים בקובץ זה:
- שימוש באתר cs.wikipedia.org
- שימוש באתר en.wikipedia.org
- שימוש באתר eo.wikipedia.org
- שימוש באתר es.wikipedia.org
- שימוש באתר fa.wikipedia.org
- שימוש באתר it.wikipedia.org
- שימוש באתר ja.wikipedia.org
- שימוש באתר ko.wikipedia.org
- שימוש באתר nl.wikipedia.org
- שימוש באתר pl.wikipedia.org
- שימוש באתר pt.wikipedia.org
- שימוש באתר sk.wikipedia.org
- שימוש באתר uk.wikipedia.org
- שימוש באתר vi.wikipedia.org
- שימוש באתר zh.wikipedia.org
.svg)