קובץ:Logistic-t-normal.svg

תוכן הדף אינו נתמך בשפות אחרות.
מתוך ויקיפדיה, האנציקלופדיה החופשית

לקובץ המקורי(קובץ SVG, הגודל המקורי: 630 × 630 פיקסלים, גודל הקובץ: 731 ק"ב)

ויקישיתוף זהו קובץ שמקורו במיזם ויקישיתוף. תיאורו בדף תיאור הקובץ המקורי (בעברית) מוצג למטה.

תקציר

תיאור
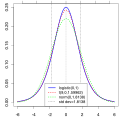
English: Comparison of standard logistic distribution with closest normal and Student's t distributions, by matching moments.

Created using the following R code:

Source Code
logistic.t.norm = function(xmin, xmax, yplot.max, filename) {
# Generate npoints from xmin to xmax
npoints=10000
scalefact=npoints/(xmax - xmin)
x=(xmin*scalefact):(xmax*scalefact)/scalefact

ylim=c(0,yplot.max) # Minimum and maximum Y limits
svg(filename)
# cex=font scaling, mai=margins (reduced as much as possible)
par(cex=1.5,mai=c(0.8,0.8,0.2,0.1))
# Plot blue logistic curve; lwd=line width, type="l" means use a line
plot(x,dlogis(x),type="l",xlab="", ylab="",lwd=3,col="blue",ylim=ylim)
abline(v=0,lty=3) # Draw a dotted vertical line at 0 (lty=line type, 3=dotted)
# Set Student t params to match moments of logistic
df = 9; shape = sqrt((df-2)/df*pi*pi/3) 
# Plot red Student t curve; lwd=line width, lty=line type (3=dotted)
points(x,dt(x/shape,df)/shape,type="l",lty=3,col="red",lwd=3)
# Set normal params to match moments of logistic
sd = sqrt(pi*pi/3)
# Draw std dev lines (currently only at +/- 1 std dev, alternatively at all of them)
#for (sdevs in 1:floor(xmax/sd)) {
for (sdevs in 1:1) {
  abline(v=-sd*sdevs,lty=2) # Draw a dashed vertical line at -1 std dev (lty 2=dashed)
  abline(v=sd*sdevs,lty=2) # Draw a dashed vertical line at +1 std dev (lty 2=dashed)
}
# Add std dev ticks along the top
axis(3,at=-floor(xmax/sd):floor(xmax/sd)*sd,labels=FALSE)
# Plot green normal curve; lwd=line width, lty=line type (3=dotted)
points(x,dnorm(x,0,sd),type="l",lty=3,col="green",lwd=3)
# Draw legend in bottom center
legend("bottom", c("logistic(0,1)", sprintf("t(%g,0,%g)",df,shape), sprintf("norm(0,%g)", sd), sprintf("std dev=%g", sd)), cex=0.9,col = c("blue","red","green", "black"), lty=c(1,3,3,2),lwd=c(3,3,3,1))
dev.off()
}

logistic.t.norm(-6,6,0.25,"logistic-t-normal.svg")
תאריך יצירה
מקור Created using R
יוצר Benwing

רישיון

אני, בעל זכויות היוצרים על היצירה הזאת, מפרסם אותה בזאת תחת הרישיונות הבאים:
GNU head מוענקת בכך הרשות להעתיק, להפיץ או לשנות את המסמך הזה, לפי תנאי הרישיון לשימוש חופשי במסמכים של גנו, גרסה 1.2 או כל גרסה מאוחרת יותר שתפורסם על־ידי המוסד לתוכנה חופשית; ללא פרקים קבועים, ללא טקסט עטיפה קדמית וללא טקסט עטיפה אחורית. עותק של הרישיון כלול בפרק שכותרתו הרישיון לשימוש חופשי במסמכים של גנו.
w:he:Creative Commons
ייחוס שיתוף זהה
הנכם רשאים:
  • לשתף – להעתיק, להפיץ ולהעביר את העבודה
  • לערבב בין עבודות – להתאים את העבודה
תחת התנאים הבאים:
  • ייחוס – יש לתת ייחוס הולם, לתת קישור לרישיון, ולציין אם נעשו שינויים. אפשר לעשות את זה בכל צורה סבירה, אבל לא בשום צורה שמשתמע ממנה שמעניק הרישיון תומך בך או בשימוש שלך.
  • שיתוף זהה – אם תיצרו רמיקס, תשנו, או תבנו על החומר, חובה עליכם להפיץ את התרומות שלך לפי תנאי רישיון זהה או תואם למקור.
הנכם מוזמנים לבחור את הרישיון הרצוי בעיניכם.

כיתובים

נא להוסיף משפט שמסביר מה הקובץ מייצג

פריטים שמוצגים בקובץ הזה

מוצג

image/svg+xml

היסטוריית הקובץ

ניתן ללחוץ על תאריך/שעה כדי לראות את הקובץ כפי שנראה באותו זמן.

תאריך/שעהתמונה ממוזערתממדיםמשתמשהערה
נוכחית07:35, 28 במרץ 2012תמונה ממוזערת לגרסה מ־07:35, 28 במרץ 2012‪630 × 630‬ (731 ק"ב)Benwingadd ticks along top
06:25, 28 במרץ 2012תמונה ממוזערת לגרסה מ־06:25, 28 במרץ 2012‪630 × 630‬ (729 ק"ב)Benwingadd std dev lines
05:36, 28 במרץ 2012תמונה ממוזערת לגרסה מ־05:36, 28 במרץ 2012‪630 × 630‬ (724 ק"ב)Benwing{{Information |description = {{en|1=Comparison of standard logistic distribution with closest normal and Student's t distributions, by matching moments. Created using the following R code: {{cot|Source Code}} <source lang="rsplus"> logistic.t.norm = fu...

אין בוויקיפדיה דפים המשתמשים בקובץ זה.

שימוש גלובלי בקובץ

אתרי הוויקי השונים הבאים משתמשים בקובץ זה: