
קובץ:Poincare-sphere arrows.svg

גודל התצוגה המקדימה הזאת מסוג PNG של קובץ ה־SVG הזה: 600 × 600 פיקסלים. רזולוציות אחרות: 240 × 240 פיקסלים | 480 × 480 פיקסלים | 768 × 768 פיקסלים | 1,024 × 1,024 פיקסלים | 2,048 × 2,048 פיקסלים.
לקובץ המקורי (קובץ SVG, הגודל המקורי: 600 × 600 פיקסלים, גודל הקובץ: 6 ק"ב)
| זהו קובץ שמקורו במיזם ויקישיתוף. תיאורו בדף תיאור הקובץ המקורי (בעברית) מוצג למטה. |
תקציר
| תיאור |
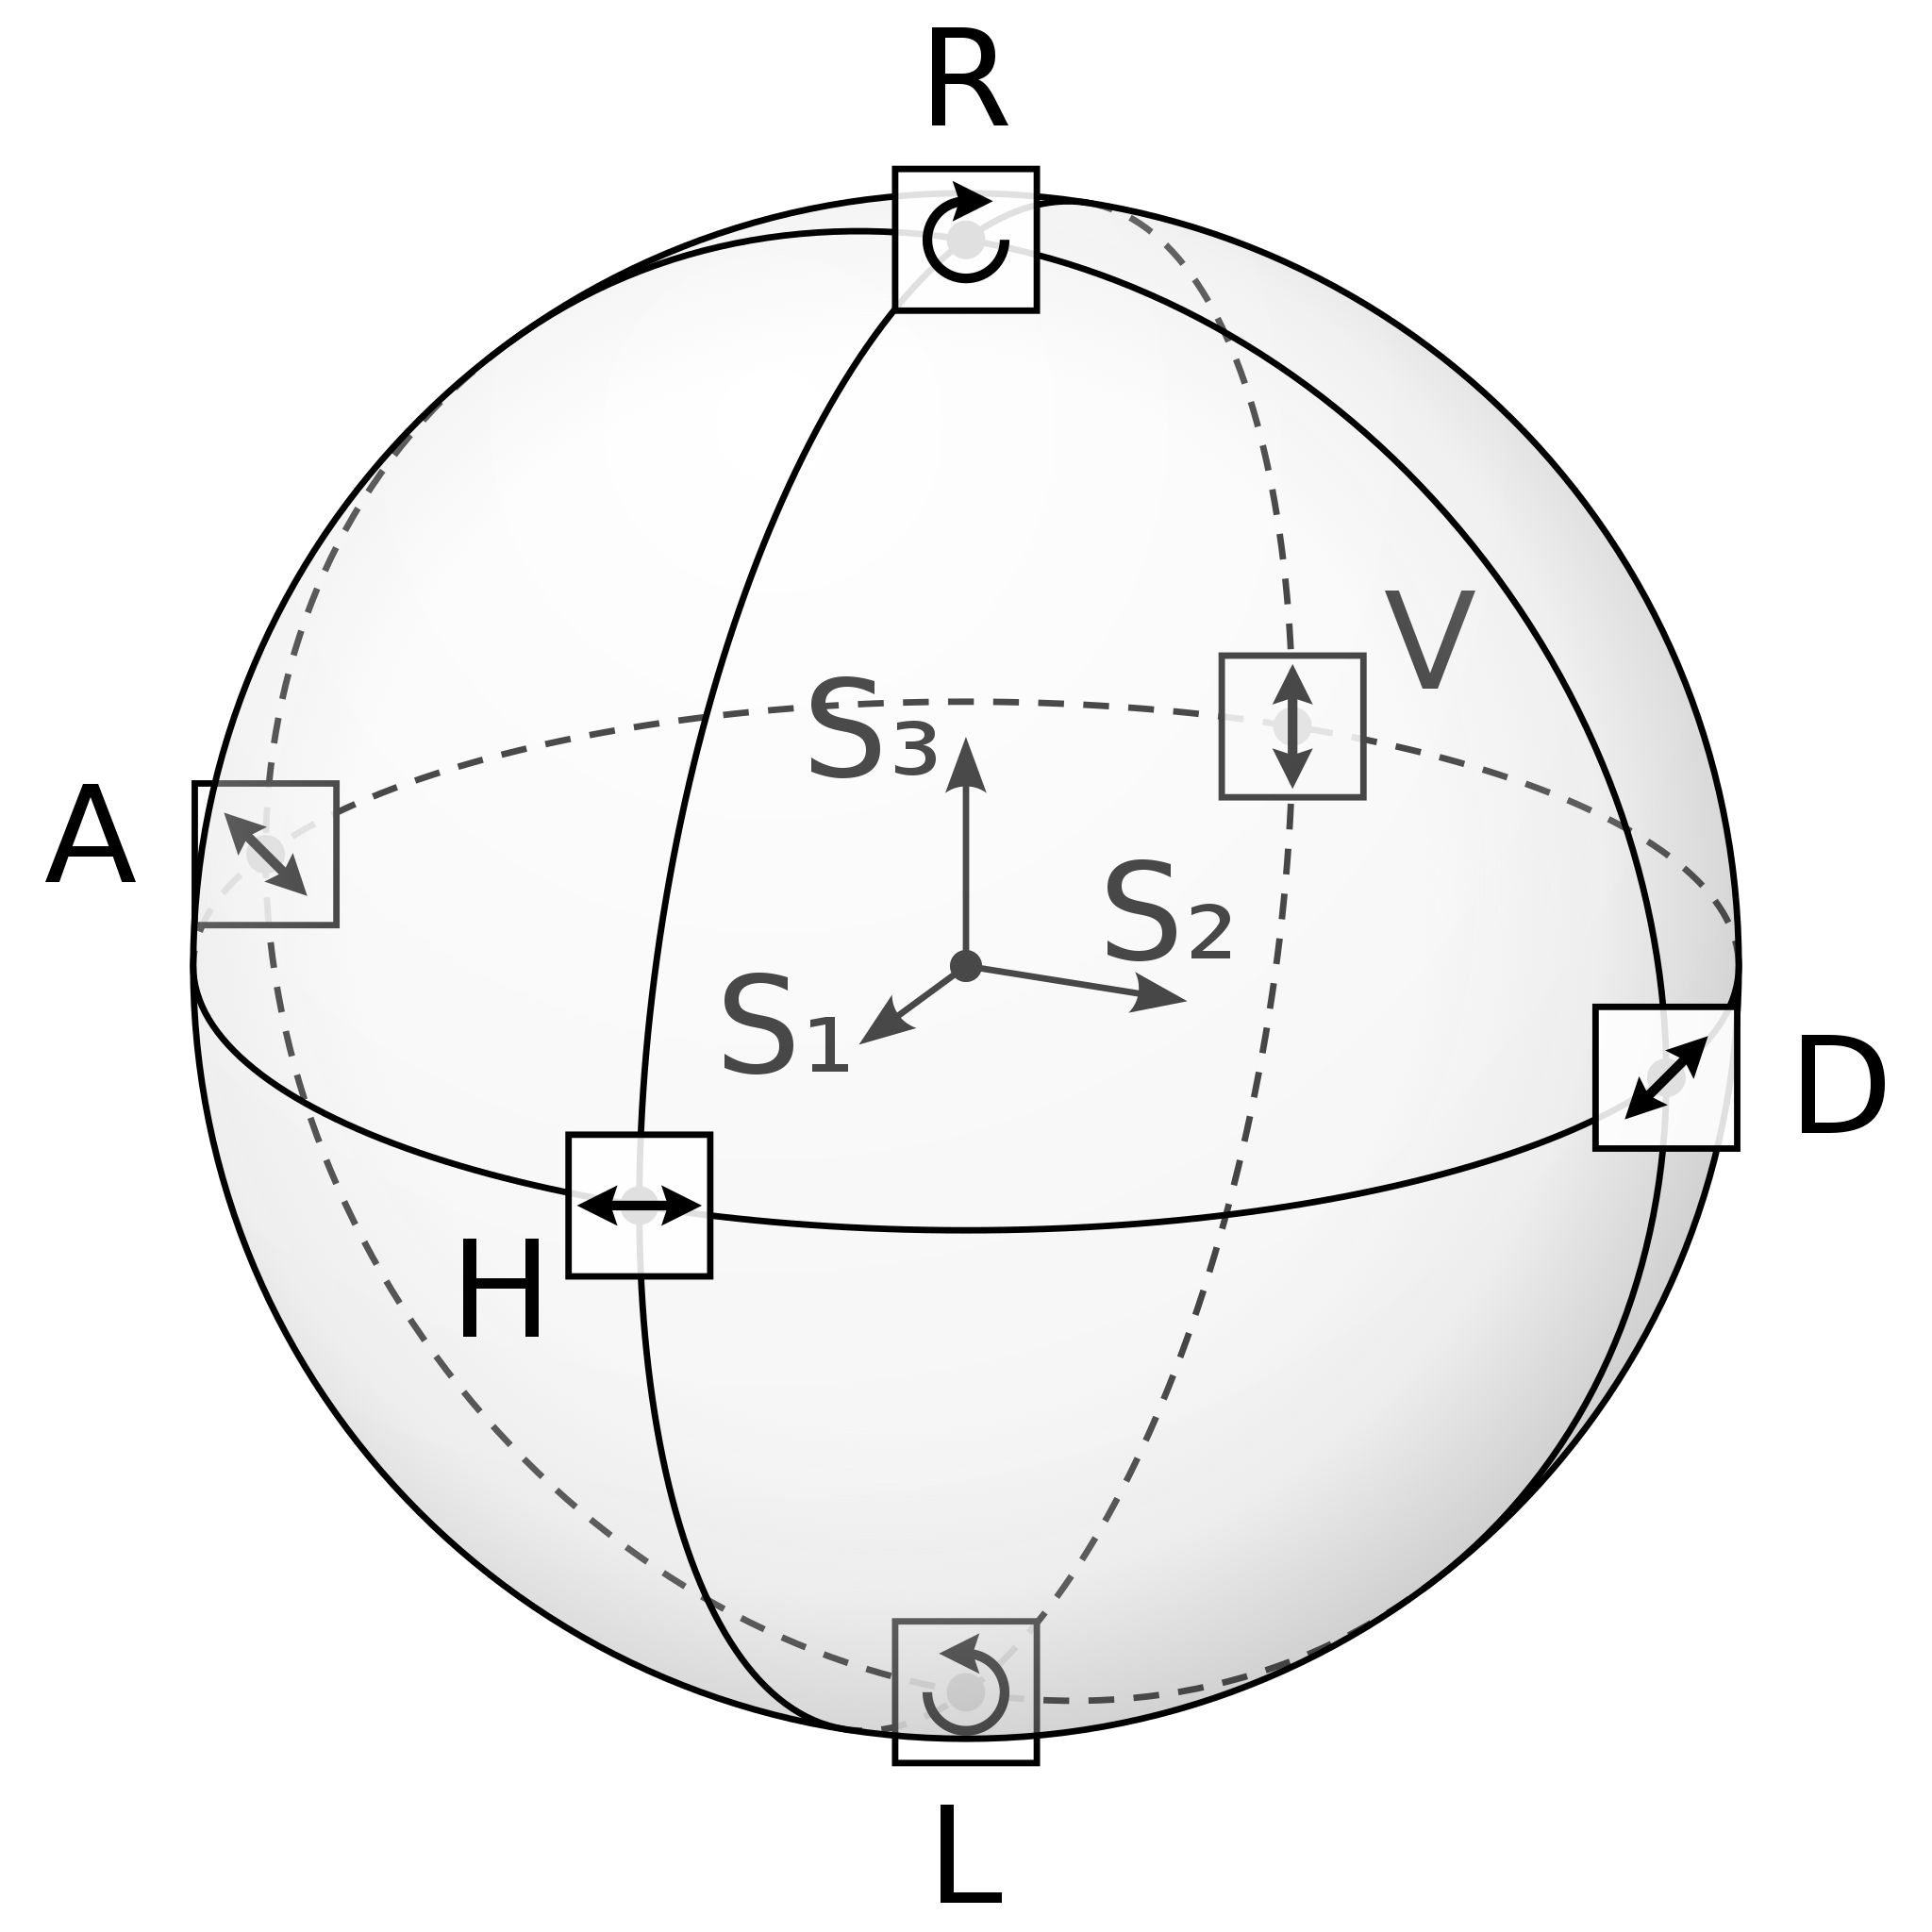
English: Drawing of a Poincaré sphere, which illustrates the space of possible polarisations of electromagnetic waves. The sphere is drawn with three great circles, labels for six basic polarisations H (linear horizontal), V (linear vertical), D (linear diagonal), A (linear antidiagonal), R (right-hand circular) and L (left-hand circular) and images of the polarisation vectors for each. Additionally the coordinate system of Stokes vectors with components S₁, S₂ and S₃ is drawn in the center of the sphere.
Deutsch: Zeichnung einer Poincaré-Kugel, die den Raum der möglichen Polarisationen elektromagnetischer Wellen darstellt. Die Kugel ist mit drei Großkreisen gezeichnet, Zeichen für die sechs Basispolarisationen H (linear horizontal), V (linear vertikal), D (linear diagonal), A (linear antidiagonal), R (rechtshändig zirkular) and L (linkshändig zirkular) und mit Bildern der Polarisationsvektoren für jede davon. Zusätzlich befindet sich im Zentrum der Kugel das Koordinatensystem aus Stokesvektorkomponenten S₁, S₂ and S₃. |
| תאריך יצירה | |
| מקור | נוצר על־ידי מעלה היצירה |
| יוצר | Geek3 |
| גרסאות אחרות | Poincare-sphere_stokes.svg (without the small images of the polarisation vectors) |
Source Code
The image is created by the following source-code. Requirements:
python source code:
try:
    import svgwrite as svg
except ImportError:
    print 'You need to install svgwrite: http://pypi.python.org/pypi/svgwrite/'
    # documentation at http://pythonhosted.org/svgwrite/
    exit(1)

from math import *

def to_xyz(theta, phi, r=1):
    return r * sin(theta) * cos(phi), r * sin(theta) * sin(phi), r * cos(theta)

def to_theta_phi_r(x, y, z):
    return atan2(z, sqrt(x**2 + y**2)), atan2(x, y), sqrt(x**2+y**2+z**2)

def rotx(x, y, z, a):
    y, z = cos(a) * y + sin(a) * z, cos(a) * z - sin(a) * y
    return x, y, z

def ellipse_path(theta, phi, tilt, flip=False):
    t, p, r2 = to_theta_phi_r(*rotx(*(to_xyz(theta, phi, 1) + (tilt,))))
    a = abs(r)
    b = abs(r * sin(t))
    return 'M %f,%f A %f,%f %f %i,%i %f,%f' % (-r*cos(p), -r*sin(p),
        a, b, p*180/pi, 0, {True:1, False:0}[flip], r*cos(p), r*sin(p))

# document
size = 600, 600
doc = svg.Drawing('poincare-sphere_arrows.svg', profile='full', size=size)
doc.set_desc('poincare-sphere_arrows.svg', '''Drawing of a poincare-sphere with polarisations H, V, D, A, R and L, a coordinate system of Stokes-Vectors P1, P2 and P3 and six little images that illustrate the polarisations
rights: GNU Free Documentation license,
        Creative Commons Attribution ShareAlike license''')

# settings
dash = '8,6'
col = 'black'
r = 240
tilt = radians(-70)
phi = radians(-25)
cp, sp = cos(phi), sin(phi)

# background
doc.add(doc.rect(id='background', profile='full', insert=(0, 0), size=size, fill='white', stroke='none'))

# arrow markers
arrow_d = 'M -4,0 L 2,-3 L 1,0 L 2,3 L -4,0 z'
arrow1 = doc.marker(id='arrow1', orient='auto', overflow='visible')
arrow1.add(doc.path(d=arrow_d, fill=col, stroke='none',
    transform='rotate(180) scale(0.7)'))
doc.defs.add(arrow1)
arrow2 = doc.marker(id='arrow2', orient='auto', overflow='visible')
arrow2.add(doc.path(d=arrow_d, fill=col, stroke='none',
    transform='scale(0.7)'))
doc.defs.add(arrow2)
arrow3 = doc.marker(id='arrow3', orient='auto', overflow='visible')
arrow3.add(doc.path(d='M 8.7185878,4.0337352 L -2.2072895,0.016013256 L 8.7185884,-4.0017078 C 6.9730900,-1.6296469 6.9831476,1.6157441 8.7185878,4.0337352 z', fill=col, stroke='none',
    transform='scale(0.8) rotate(180)'))
doc.defs.add(arrow3)

# make a group for the sphere
sphere = doc.g(transform='translate(300, 300)', fill='none', stroke=col, stroke_width='2')
sphere['font-family'] = 'DejaVu Sans'
sphere['font-size'] = '42px'
doc.add(sphere)

# back ellipses
sphere.add(doc.path(d=ellipse_path(0, 0, tilt),
    stroke_dasharray=dash, stroke=col))
sphere.add(doc.path(d=ellipse_path(pi/2, phi, tilt, True),
    stroke_dasharray=dash, stroke=col))
sphere.add(doc.path(d=ellipse_path(pi/2, phi+pi/2, tilt),
    stroke_dasharray=dash, stroke=col))

# draw coordinate axes
sphere.add(doc.circle(center=(0, 0), r=5, fill=col, stroke='none'))
for i in range(3):
    xyz = [0, 0, 0]
    xyz[i] = 0.3 * r
    x, y, z = xyz
    x, y, z = rotx(x*cp + y*sp, y*cp - x*sp, z, tilt)
    line = doc.line(start=(0, 0), end=('%f' % x, '%f' % y), stroke=col)
    line['marker-end'] = arrow3.get_funciri()
    sphere.add(line)

# the six defined points
pts = []
for x,y,z in [[0,0,-1], [0,0,1], [0,-1,0], [0,1,0], [-1,0,0], [1,0,0]]:
    x, y, z = rotx(r * (x*cp + y*sp), r * (y*cp - x*sp), r * z, tilt)
    if z >= 0:
        continue
    pts.append((x, y))
    sphere.add(doc.circle(center=('%f' % x, '%f' % y), r=6,
        fill=col, stroke='none'))

# inset images
rect = doc.rect((-22, -22), (44, 44), fill='white', stroke=col, fill_opacity=0.88)

gV = doc.g(transform='translate(%f, %f)' % pts[1])
gV.add(rect)
gV.add(doc.line(start=(0,-11), end=(0,11), stroke_width=3,
    marker_end=arrow1.get_funciri(), marker_start=arrow2.get_funciri()))
sphere.add(gV)

gA = doc.g(transform='translate(%f, %f)' % pts[2])
gA.add(rect)
gA.add(doc.line(start=(-7,-7), end=(7,7), stroke_width=3,
    marker_end=arrow1.get_funciri(), marker_start=arrow2.get_funciri()))
sphere.add(gA)

gL = doc.g(transform='translate(%f, %f)' % pts[0])
gL.add(rect)
gL.add(doc.path(d='M -12,0 A 12,12 0 1,0 0,-12', stroke_width=3,
    marker_end=arrow1.get_funciri()))
sphere.add(gL)

# V label
sphere.add(doc.text('V', text_anchor='middle',
    transform='translate(144, -86)', stroke='none', fill=col))

# Stokes-Vector labels
sphere.add(doc.text('S₁', text_anchor='middle',
    transform='translate(-56, 33)', stroke='none', fill=col))
sphere.add(doc.text('S₂', text_anchor='middle',
    transform='translate(63, -2)', stroke='none', fill=col))
sphere.add(doc.text('S₃', text_anchor='middle',
    transform='translate(-29, -59)', stroke='none', fill=col))

# sphere surface
grad1 = doc.defs.add(doc.radialGradient(id='grad1',
    center=(0.375, 0.15), r=0.75, gradientUnits='objectBoundingBox'))
grad1.add_stop_color(offset=0, color='#ffffff', opacity=0.3)
grad1.add_stop_color(offset=1, color='#dddddd', opacity=0.3)
sphere.add(doc.circle(center=(0, 0), r=str(r),
    fill='url(#grad1)', stroke='none'))
grad2 = doc.defs.add(doc.radialGradient(id='grad2',
    center=(0.45, 0.45), r=0.575, gradientUnits='objectBoundingBox'))
grad2.add_stop_color(offset=0.6, color='#cccccc', opacity=0)
grad2.add_stop_color(offset=0.8, color='#cccccc', opacity=0.2)
grad2.add_stop_color(offset=1, color='#333333', opacity=0.2)
sphere.add(doc.circle(center=(0, 0), r=str(r),
    fill='url(#grad2)', stroke='none'))

# the six defined points
for x,y,z in [[0,0,-1], [0,0,1], [0,-1,0], [0,1,0], [-1,0,0], [1,0,0]]:
    x, y, z = rotx(r * (x*cp + y*sp), r * (y*cp - x*sp), r * z, tilt)
    if z < 0:
        continue
    pts.append((x, y))
    sphere.add(doc.circle(center=('%f' % x, '%f' % y), r=6,
        fill=col, stroke='none'))

# H, D, A, R, L labels
sphere.add(doc.text('H', text_anchor='middle',
    transform='translate(-144, 115)', stroke='none', fill=col))
sphere.add(doc.text('D', text_anchor='middle',
    transform='translate(272, 52)', stroke='none', fill=col))
sphere.add(doc.text('A', text_anchor='middle',
    transform='translate(-272, -26)', stroke='none', fill=col))
sphere.add(doc.text('R', text_anchor='middle',
    transform='translate(0, -261)', stroke='none', fill=col))
sphere.add(doc.text('L', text_anchor='middle',
    transform='translate(0, 291)', stroke='none', fill=col))

# front ellipses
sphere.add(doc.path(d=ellipse_path(0, 0, tilt, True)))
sphere.add(doc.path(d=ellipse_path(pi/2, phi, tilt)))
sphere.add(doc.path(d=ellipse_path(pi/2, phi+pi/2, tilt, True)))

# circle edge
sphere.add(doc.circle(center=(0, 0), r=str(r)))

# inset images
gH = doc.g(transform='translate(%f, %f)' % pts[4])
gH.add(rect)
gH.add(doc.line(start=(-11,0), end=(11,0), stroke_width=3,
    marker_end=arrow1.get_funciri(), marker_start=arrow2.get_funciri()))
sphere.add(gH)

gD = doc.g(transform='translate(%f, %f)' % pts[5])
gD.add(rect)
gD.add(doc.line(start=(-7,7), end=(7,-7), stroke_width=3,
    marker_end=arrow1.get_funciri(), marker_start=arrow2.get_funciri()))
sphere.add(gD)

gR = doc.g(transform='translate(%f, %f)' % pts[3])
gR.add(rect)
gR.add(doc.path(d='M 12,0 A 12,12 0 1,1 0,-12', stroke_width=3,
    marker_end=arrow1.get_funciri()))
sphere.add(gR)

doc.save()
רישיון
אני, בעל זכויות היוצרים על היצירה הזאת, מפרסם אותה בזאת תחת הרישיונות הבאים:

|
מוענקת בכך הרשות להעתיק, להפיץ או לשנות את המסמך הזה, לפי תנאי הרישיון לשימוש חופשי במסמכים של גנו, גרסה 1.2 או כל גרסה מאוחרת יותר שתפורסם על־ידי המוסד לתוכנה חופשית; ללא פרקים קבועים, ללא טקסט עטיפה קדמית וללא טקסט עטיפה אחורית. עותק של הרישיון כלול בפרק שכותרתו הרישיון לשימוש חופשי במסמכים של גנו. |
הקובץ הזה מתפרסם לפי תנאי רישיון קריאייטיב קומונז ייחוס 3.0 לא מותאם.
- הנכם רשאים:
- לשתף – להעתיק, להפיץ ולהעביר את העבודה
- לערבב בין עבודות – להתאים את העבודה
- תחת התנאים הבאים:
- ייחוס – יש לתת ייחוס הולם, לתת קישור לרישיון, ולציין אם נעשו שינויים. אפשר לעשות את זה בכל צורה סבירה, אבל לא בשום צורה שמשתמע ממנה שמעניק הרישיון תומך בך או בשימוש שלך.
הנכם מוזמנים לבחור את הרישיון הרצוי בעיניכם.
היסטוריית הקובץ
ניתן ללחוץ על תאריך/שעה כדי לראות את הקובץ כפי שנראה באותו זמן.
| תאריך/שעה | תמונה ממוזערת | ממדים | משתמש | הערה | |
|---|---|---|---|---|---|
| נוכחית | 20:44, 31 באוגוסט 2014 | | 600 × 600 (6 ק"ב) | Geek3 | Poincare Sphere with Stokes vectors and polarisation arrows |
שימוש בקובץ
![]() אין בוויקיפדיה דפים המשתמשים בקובץ זה.
אין בוויקיפדיה דפים המשתמשים בקובץ זה.
שימוש גלובלי בקובץ
אתרי הוויקי השונים הבאים משתמשים בקובץ זה:
- שימוש באתר ar.wikipedia.org
- שימוש באתר de.wikipedia.org