
קובץ:Nomogramm zum scheinbaren Einfallen nach Palmer.pdf

גודל התצוגה המקדימה הזאת מסוג JPG של קובץ ה־PDF הזה: 430 × 599 פיקסלים. רזולוציות אחרות: 172 × 240 פיקסלים | 345 × 480 פיקסלים | 551 × 768 פיקסלים | 1,170 × 1,629 פיקסלים.
לקובץ המקורי (1,170 × 1,629 פיקסלים, גודל הקובץ: 165 ק"ב, סוג MIME: application/pdf)
| זהו קובץ שמקורו במיזם ויקישיתוף. תיאורו בדף תיאור הקובץ המקורי (בעברית) מוצג למטה. |
תקציר
| תיאור |
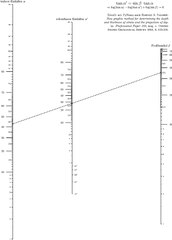
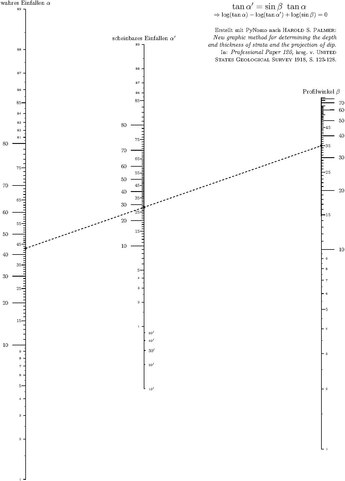
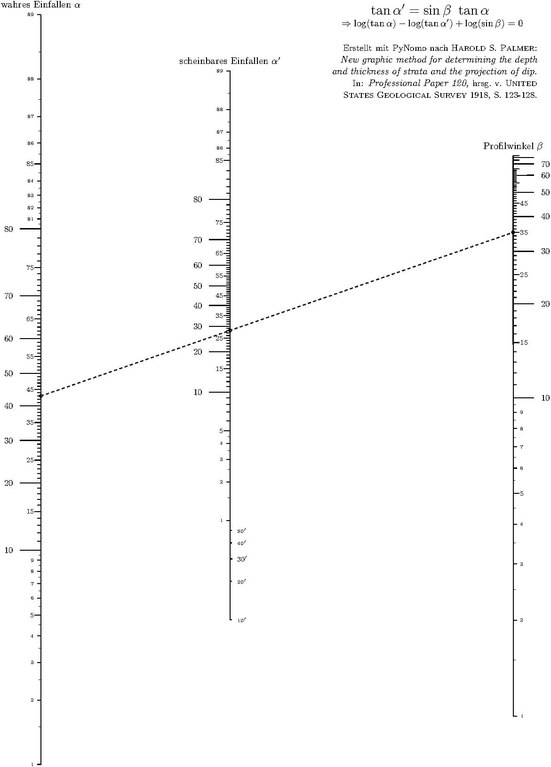
English: Created with PyNomo after Harold S. Palmer: New graphic method for determining the depth and thickness of strata and the projection of dip. In: Professional Paper 120, published by United States Geological Survey 1918, pp. 123-128.
Deutsch: Erstellt mit PyNomo nach Harold S. Palmer: New graphic method for determining the depth and thickness of strata and the projection of dip. In: Professional Paper 120, hrsg. v. United States Geological Survey 1918, S. 123-128. |
| תאריך יצירה | |
| מקור | נוצר על־ידי מעלה היצירה |
| יוצר | Gallaiis |
Python code used to create this nomogram with PyNomo.
from pynomo.nomographer import *

N_params_1={
    'u_min':1.0,
    'u_max':89.0,
    'function':lambda u:log10(tan(u*pi/180.0)),
    'title':r'wahres Einfallen $\alpha$',
    'title_x_shift':0.0,
    'tick_levels':3,
    'tick_text_levels':2,
    'tick_side':'left',
    'extra_params':[
      {
        'u_min':1.0,
        'u_max':10.0,
        'tick_levels':4,
        'tick_text_levels':3,
      },
      {
        'u_min':80.0,
        'u_max':89.0,
        'tick_levels':4,
        'tick_text_levels':3,
      },
    ],
}

N_params_2={
    'u_min':0.5,
    'u_max':89.0,
    'function':lambda u:-log10(tan(u*pi/180.0)),
    'title':r'scheinbares Einfallen $\alpha^\prime$',
    'tick_levels':3,
    'tick_text_levels':2,
    'tick_side':'left',
    'extra_params':[
      {
        'u_min':(10.0/60.0),
        'u_max':(25.0/60.0),
        'scale_type':'manual line',
        'tick_side':'right',
        'grid_length_1':0.050,
        'manual_axis_data':{
          (10.0/60.0):r"\tiny $10'$",
          (20.0/60.0):r"\tiny $20'$",
        }
      },
      {
        'u_min':(25.0/60.0),
        'u_max':(35.0/60.0),
        'scale_type':'manual line',
        'tick_side':'right',
        'grid_length_1':0.070,
        'manual_axis_data':{
          (30.0/60.0):r"\scriptsize $30'$",
        }
      },
      {
        'u_min':(35.0/60.0),
        'u_max':1.0,
        'scale_type':'manual line',
        'tick_side':'right',
        'grid_length_1':0.050,
        'manual_axis_data':{
          (40.0/60.0):r"\tiny $40'$",
          (50.0/60.0):r"\tiny $50'$",
        }
      },
      {
        'u_min':1.0,
        'u_max':5.0,
        'tick_levels':4,
        'tick_text_levels':3,
      },
      {
        'u_min':85.0,
        'u_max':89.0,
        'tick_levels':4,
        'tick_text_levels':3,
      },
    ],
}

N_params_3={
    'u_min':1,
    'u_max':85.,
    'function':lambda u:log10(sin(u*pi/180.0)),
    'title':r'Profilwinkel $\beta$',
    'tick_levels':2,
    'tick_text_levels':0,
    'extra_params':[
      {
        'u_min':1.0,
        'u_max':10.0,
        'tick_levels':4,
        'tick_text_levels':3,
      },
      {
        'u_min':11.0,
        'u_max':20.0,
        'tick_levels':3,
        'tick_text_levels':2,
      },
      {
        'u_min':21.0,
        'u_max':50.0,
        'tick_levels':3,
        'tick_text_levels':2,
      },
      {
        'u_min':51.0,
        'u_max':65.0,
        'tick_levels':3,
        'tick_text_levels':1,
      },
      {
        'u_min':65.0,
        'u_max':70.0,
        'tick_levels':2,
        'tick_text_levels':1,
      },
    ],
}

block_1_params={
    'block_type':'type_1',
    'f1_params':N_params_1,
    'f2_params':N_params_2,
    'f3_params':N_params_3,
    'proportion':(6.25/9.35),
    'isopleth_values':[[43.0,'x',35.0]],
}

main_params={
    'filename':'Nomogramm_scheinbares_Einfallen_Palmer.pdf',
    'paper_height':27.0,
    'paper_width':17.0,
    'block_params':[block_1_params],
    'title_str':r'\Large $\tan\alpha^\prime=\sin\beta\ \tan\alpha$\par\
        \normalsize $\Rightarrow \log(\tan\alpha) - \log(\tan\alpha^\prime) + \log(\sin\beta) = 0$\par\
        \raggedright\small\vskip 0.3ex\
        Erstellt mit PyNomo nach H\scriptsize AROLD\small\ S.\ P\scriptsize ALMER\small:\
        \it New graphic method for determining the depth\
        and thickness of strata and the projection of dip.\rm\small\par\
        In: \it Professional Paper 120,\rm\small\ hrsg.\ v.\
        U\scriptsize NITED\small\ S\scriptsize TATES\small\
        G\scriptsize EOLOGICAL\small\ S\scriptsize URVEY\small\ 1918, S.\ 123-128.',
    'title_x':14.0,
}

Nomographer(main_params)
רישיון
אני, בעל זכויות היוצרים על עבודה זו, מפרסם בזאת את העבודה תחת הרישיון הבא:
הקובץ הזה מתפרסם לפי תנאי רישיון קריאייטיב קומונז ייחוס-שיתוף זהה 3.0 לא מותאם.
- הנכם רשאים:
- לשתף – להעתיק, להפיץ ולהעביר את העבודה
- לערבב בין עבודות – להתאים את העבודה
- תחת התנאים הבאים:
- ייחוס – יש לתת ייחוס הולם, לתת קישור לרישיון, ולציין אם נעשו שינויים. אפשר לעשות את זה בכל צורה סבירה, אבל לא בשום צורה שמשתמע ממנה שמעניק הרישיון תומך בך או בשימוש שלך.
- שיתוף זהה – אם תיצרו רמיקס, תשנו, או תבנו על החומר, חובה עליכם להפיץ את התרומות שלך לפי תנאי רישיון זהה או תואם למקור.
היסטוריית הקובץ
ניתן ללחוץ על תאריך/שעה כדי לראות את הקובץ כפי שנראה באותו זמן.
| תאריך/שעה | תמונה ממוזערת | ממדים | משתמש | הערה | |
|---|---|---|---|---|---|
| נוכחית | 19:19, 9 באוגוסט 2012 |  | 1,629 × 1,170 (165 ק"ב) | Gallaiis |
שימוש בקובץ
![]() אין בוויקיפדיה דפים המשתמשים בקובץ זה.
אין בוויקיפדיה דפים המשתמשים בקובץ זה.
שימוש גלובלי בקובץ
אתרי הוויקי השונים הבאים משתמשים בקובץ זה:
- שימוש באתר de.wikipedia.org