
קובץ:Simpson's paradox continuous.svg

גודל התצוגה המקדימה הזאת מסוג PNG של קובץ ה־SVG הזה: 390 × 260 פיקסלים. רזולוציות אחרות: 320 × 213 פיקסלים | 640 × 427 פיקסלים | 1,024 × 683 פיקסלים | 1,280 × 853 פיקסלים | 2,560 × 1,707 פיקסלים.
לקובץ המקורי (קובץ SVG, הגודל המקורי: 390 × 260 פיקסלים, גודל הקובץ: 18 ק"ב)
| זהו קובץ שמקורו במיזם ויקישיתוף. תיאורו בדף תיאור הקובץ המקורי (בעברית) מוצג למטה. |
W3C-validity not checked.
תקציר
| תיאור |
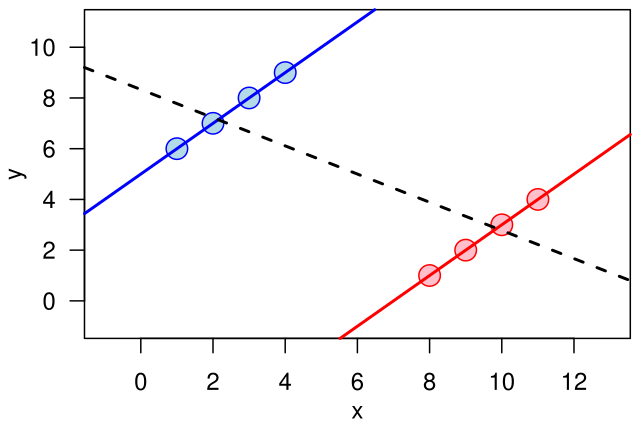
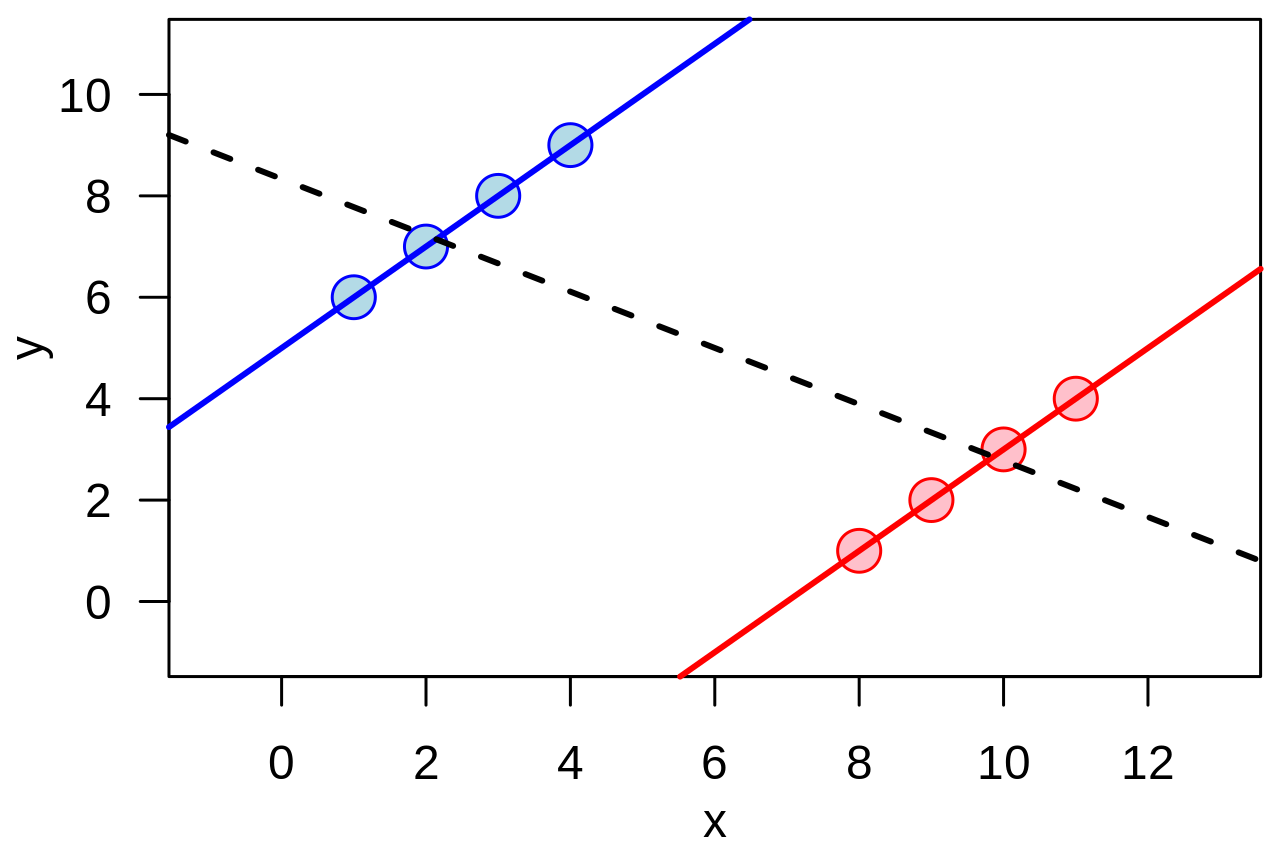
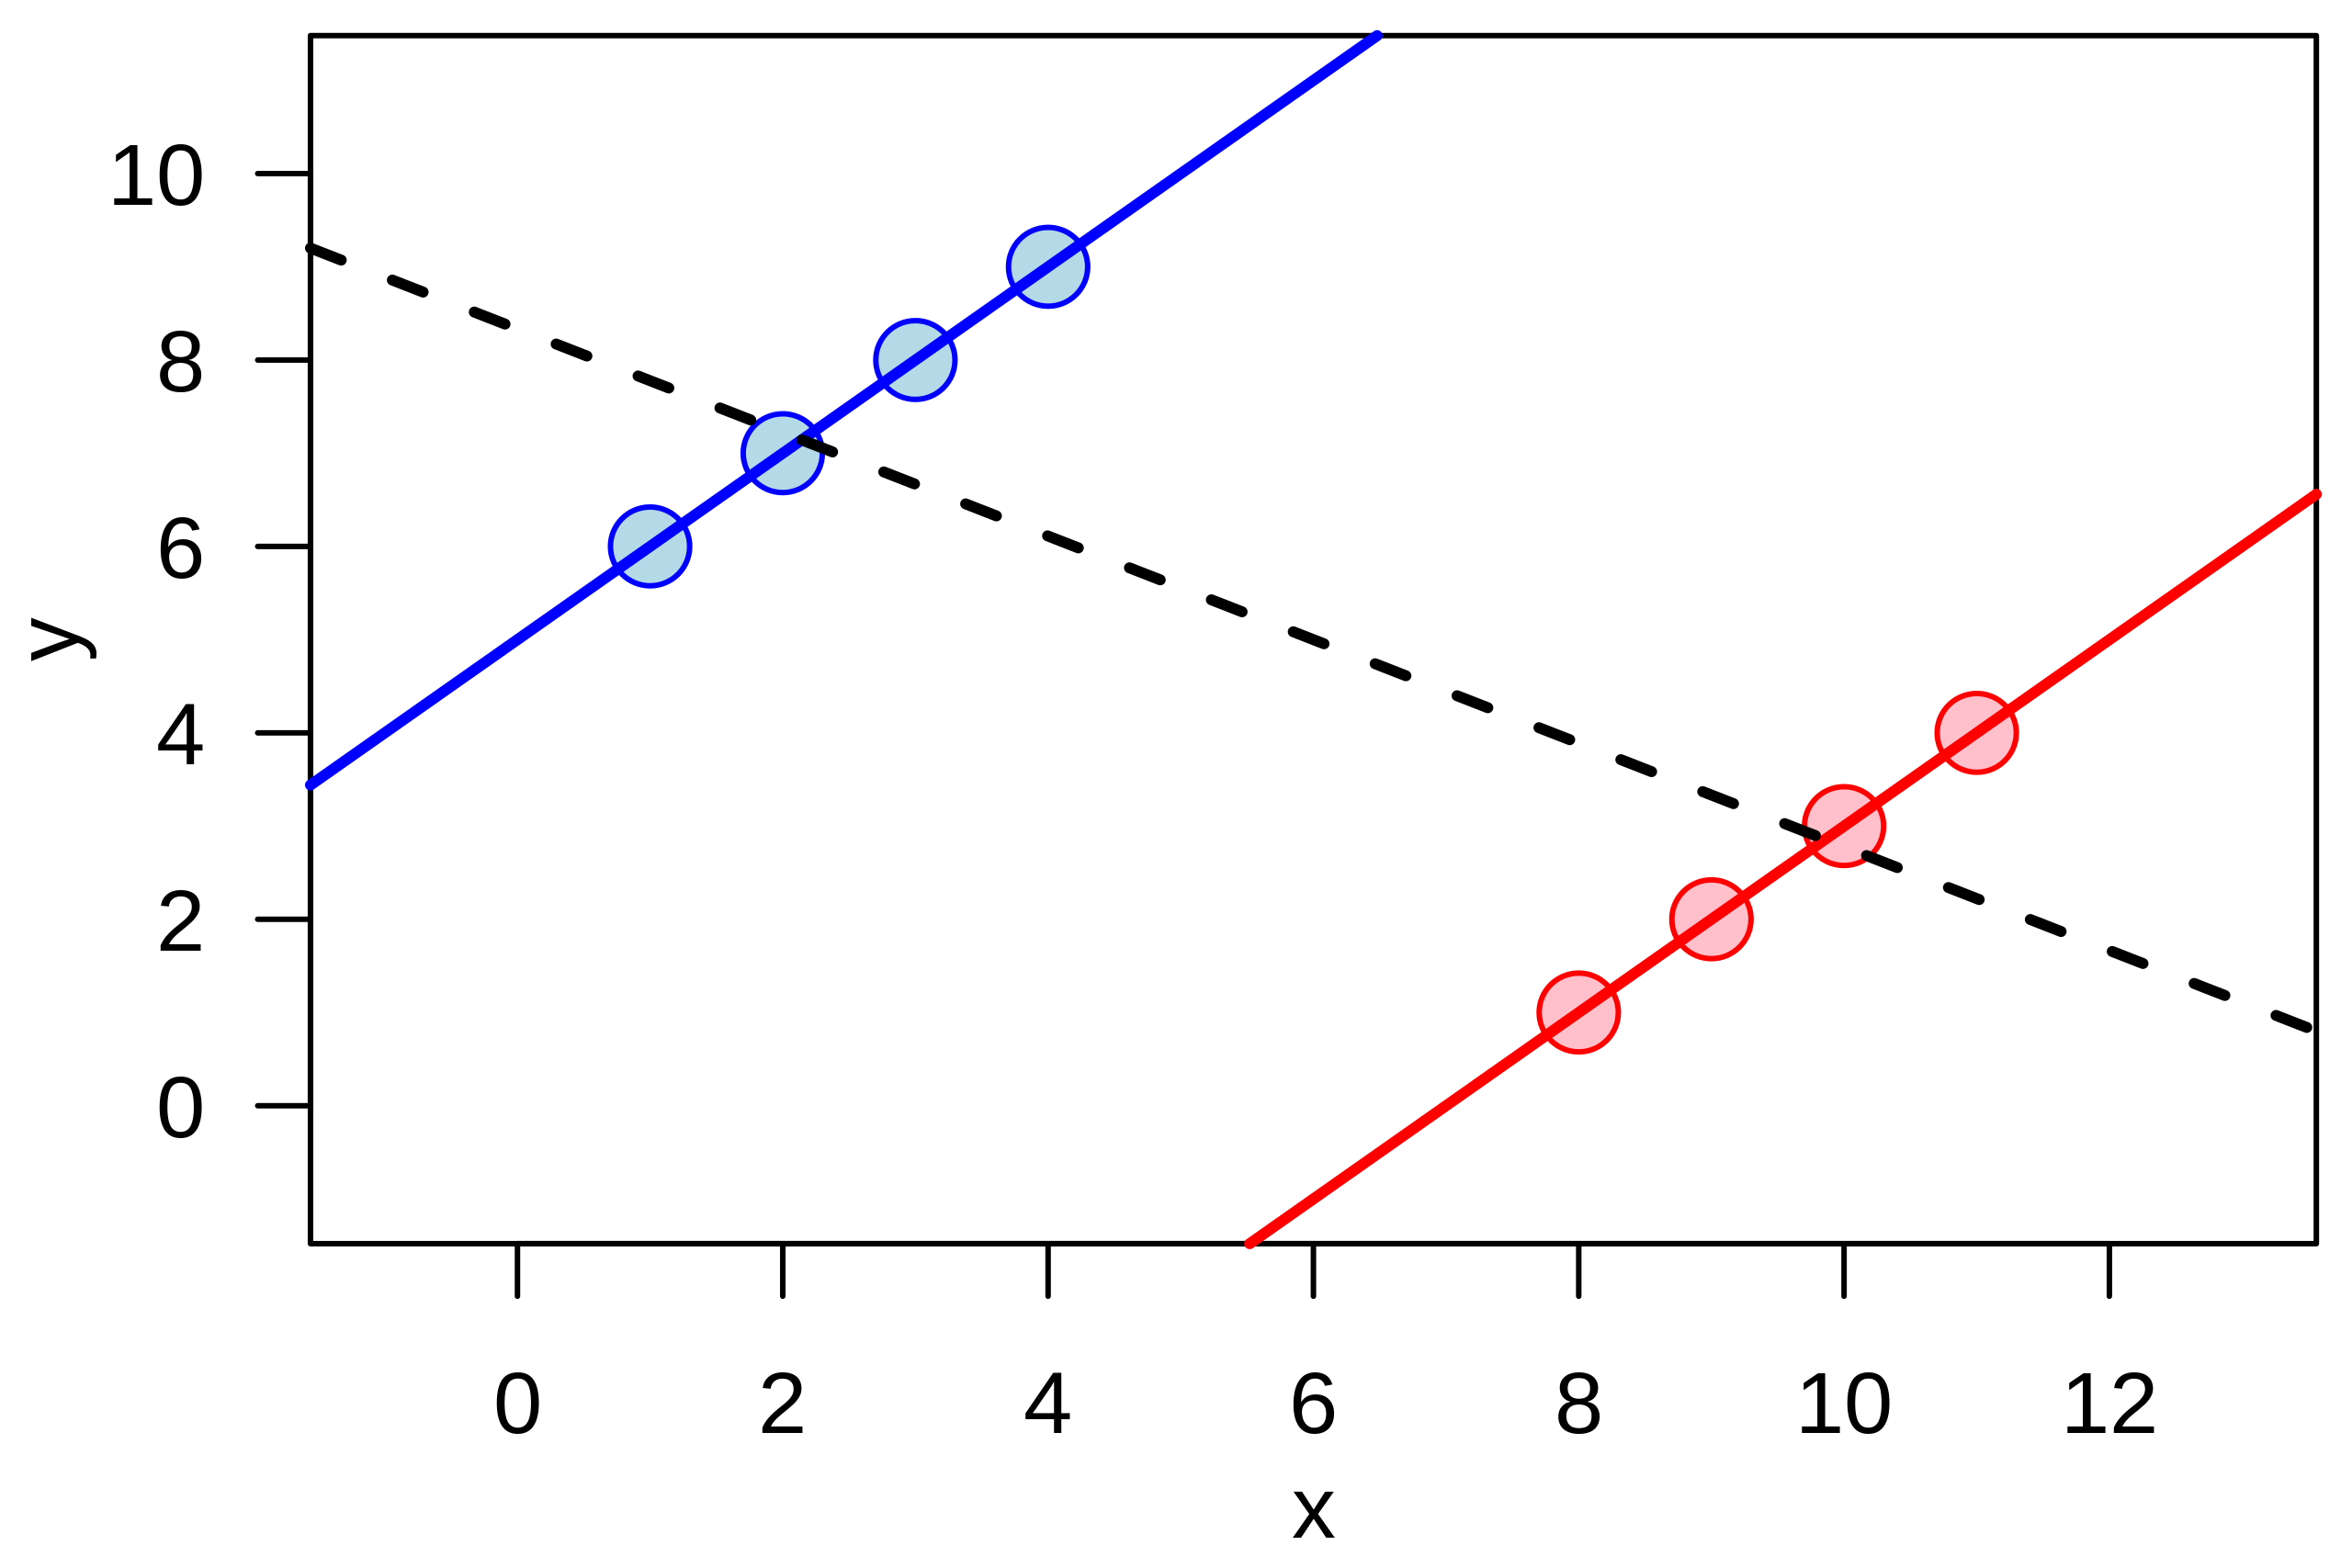
English: Illustration of the quantitative version of en:Simpson's paradox: a positive trend appears for two separate groups (blue and red), whereas a negative trend (black, dashed) appears when the groups are combined. |
| תאריך יצירה | |
| מקור | נוצר על־ידי מעלה היצירה |
| יוצר | Schutz |
Example of the quantitative version of w:Simpson's paradox.
The graphic was created by User:Schutz for Wikipedia on 14 June 2007, using the R statistical project. The program that generated and exported the graphic is given below; the uploaded version was generated slightly differently to workaround a bug during the PS to SVG conversion with pstoedit command. The layout was slightly modified using Inkscape before upload.
  x1 <- c(1,2,3,4)
  y1 <- x1 + 5

  x2 <- x1 + 7
  y2 <- x2 - 7

  x <- c(x1,x2)
  y <- c(y1,y2)

  postscript("simpson.eps", paper="special", width=4.5, height=3)

  par(las=1)
  par(mar=c(3,3,0.5,0.5))
  par(mgp=c(2,1,0))

  plot(x,y, cex=2, pch=21,
       col=rep(c("blue", "red"), each=4), bg=rep(c("lightblue", "pink"), each=4),
       xlim=range(x)+c(-2,2), ylim=range(y)+c(-2,2))
  abline(lm(y1 ~ x1), col="blue", lwd=2)
  abline(lm(y2 ~ x2), col="red", lwd=2)
  abline(lm(y  ~ x), lwd=2, lty=2)

  dev.off()
. R עם נוצרה ה תמונה
רישיון
| היצירה הזאת שוחררה לנחלת הכלל על־ידי היוצר שלה, I, Schutz. זה תקף בכל העולם. יש מדינות שבהן הדבר אינו אפשרי על פי חוק, אם כך: I, Schutz מעניק לכל אחד את הזכות להשתמש ביצירה הזאת לכל מטרה, ללא שום תנאי, אלא אם כן תנאים כאלה נדרשים לפי החוק. |
. R עם נוצרה ה תמונה
היסטוריית הקובץ
ניתן ללחוץ על תאריך/שעה כדי לראות את הקובץ כפי שנראה באותו זמן.
| תאריך/שעה | תמונה ממוזערת | ממדים | משתמש | הערה | |
|---|---|---|---|---|---|
| נוכחית | 02:15, 14 ביוני 2007 | | 260 × 390 (18 ק"ב) | Schutz | {{Information |Description=Illustration of the continuous version of Simpson's paradox |Source=self-made |Date=14 June 2007 |Author=Schutz }} Example of the continuous version of w:Simpson's paradox. The graphic was created by [[User |
שימוש בקובץ
הדף הבא משתמש בקובץ הזה:
שימוש גלובלי בקובץ
אתרי הוויקי השונים הבאים משתמשים בקובץ זה:
- שימוש באתר ar.wikipedia.org
- שימוש באתר ca.wikipedia.org
- שימוש באתר cs.wikipedia.org
- שימוש באתר cy.wikipedia.org
- שימוש באתר de.wikipedia.org
- שימוש באתר en.wikipedia.org
- שימוש באתר es.wikipedia.org
- שימוש באתר eu.wikipedia.org
- שימוש באתר fi.wikipedia.org
- שימוש באתר fr.wikipedia.org
- שימוש באתר ko.wikipedia.org
- שימוש באתר nl.wikipedia.org
- שימוש באתר no.wikipedia.org
- שימוש באתר pl.wikipedia.org
- שימוש באתר pt.wikipedia.org
- שימוש באתר ru.wikipedia.org
- שימוש באתר sk.wikipedia.org
- שימוש באתר ta.wikipedia.org
- שימוש באתר uk.wikipedia.org
- שימוש באתר vi.wikipedia.org
- שימוש באתר www.wikidata.org
- שימוש באתר zh.wikipedia.org