
קובץ:South Africa 2011 dominant population group map.svg

גודל התצוגה המקדימה הזאת מסוג PNG של קובץ ה־SVG הזה: 684 × 599 פיקסלים. רזולוציות אחרות: 274 × 240 פיקסלים | 548 × 480 פיקסלים | 876 × 768 פיקסלים | 1,168 × 1,024 פיקסלים | 2,337 × 2,048 פיקסלים | 809 × 709 פיקסלים.
לקובץ המקורי (קובץ SVG, הגודל המקורי: 809 × 709 פיקסלים, גודל הקובץ: 787 ק"ב)
| זהו קובץ שמקורו במיזם ויקישיתוף. תיאורו בדף תיאור הקובץ המקורי (בעברית) מוצג למטה. |
תקציר
| תיאור |
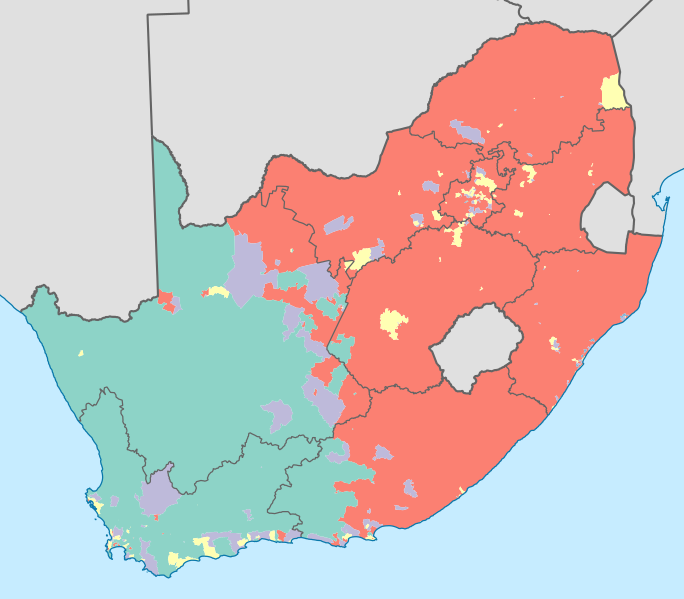
English: Map showing the dominant population groups in South Africa, according to Census 2011, at electoral ward level. A population group is considered dominant if it makes up more than 50% of the population in a ward, or if it makes up more than 33% and no other group makes up more than 25%.
Black African
Coloured
Indian or Asian
White
No group dominant
Projection is Albers Equal-Area Conic, with standard parallels at 25.5° S and 31.5° S, and origin at 28.5° S 25.5° E. |
| תאריך יצירה | |
| מקור | Statistics South Africa's Census 2011 is the source of the basic population data. The map results from my own processing of the data. The map results from my own processing of the data. For ward boundaries see File:South Africa electoral wards 2011 blank.svg. |
| יוצר | Htonl |
| גרסאות אחרות |
South Africa 2011 dominant population group map (hex cells).svg: .svg) |
רישיון
The following license applies to the population data on which the map is based:

|
בעלי זכויות היוצרים על הקובץ הזה, Stats SA, מאשרים לכולם להשתמש בו לכל מטרה, בתנאי שניתן לבעלי הזכויות ייחוס נאות. הפצה, יצירות נגזרות, שימושים מסחריים וכל שימוש אחר מותרים. |
ייחוס:
"the user acknowledges Stats SA as the source of the basic data wherever they process, apply, utilise, publish or distribute the data, and also that they specify that the relevant application and analysis (where applicable) result from their own processing of the data" [1]
|
The following tag applies to the map itself:
| ברצוני, בעלי זכויות היוצרים על יצירה זו, לשחרר יצירה זו לנחלת הכלל. זה תקף בכל העולם. יש מדינות שבהן הדבר אינו אפשרי על פי חוק, אם כך: אני מעניק לכל אחד את הזכות להשתמש בעבודה זו לכל מטרה שהיא, ללא תנאים כלשהם, אלא אם כן תנאים כאלה נדרשים על פי חוק. |
היסטוריית הקובץ
ניתן ללחוץ על תאריך/שעה כדי לראות את הקובץ כפי שנראה באותו זמן.
| תאריך/שעה | תמונה ממוזערת | ממדים | משתמש | הערה | |
|---|---|---|---|---|---|
| נוכחית | 03:13, 17 באפריל 2013 | | 709 × 809 (787 ק"ב) | Htonl | =={{int:filedesc}}== {{Information |Description={{en|1=Map showing the dominant population groups in South Africa, according to Census 2011, at electoral ward level. A population group is considered dominant if it makes up more than 50% of the populati... |
שימוש בקובץ
הדף הבא משתמש בקובץ הזה:
שימוש גלובלי בקובץ
אתרי הוויקי השונים הבאים משתמשים בקובץ זה:
- שימוש באתר af.wikipedia.org
- שימוש באתר cs.wikipedia.org
- שימוש באתר es.wikipedia.org
- שימוש באתר fr.wikipedia.org
- שימוש באתר it.wikipedia.org
- שימוש באתר ka.wikipedia.org
- שימוש באתר pt.wikipedia.org
- שימוש באתר ro.wikipedia.org
- שימוש באתר ru.wikipedia.org
- שימוש באתר sr.wikipedia.org
- שימוש באתר tg.wikipedia.org
- שימוש באתר uk.wikipedia.org
- שימוש באתר zh.wikipedia.org