
קובץ:CO2 responsibility 1950-2000.svg

לקובץ המקורי (קובץ SVG, הגודל המקורי: 940 × 477 פיקסלים, גודל הקובץ: 1.98 מ"ב)
| זהו קובץ שמקורו במיזם ויקישיתוף. תיאורו בדף תיאור הקובץ המקורי (בעברית) מוצג למטה. |
תקציר
| תיאור |
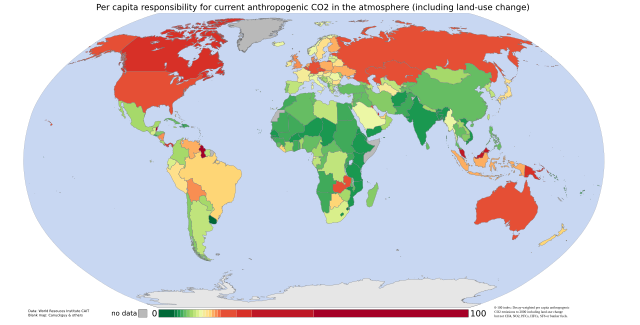
English: Cumulative per capita responsibility for anthropogenic CO2
Data from the World Resources Institute's CAIT 4.0 database (registration required). Includes CO2 emitted up to the year 2000 only (not CH4, N20, PFCs, HFCs or SF6). Estimates of the effects of land-use change are included; bunker-fuel emissions are not. The scale is a 0-100 decay-weighted index. The land-use estimates include the following (list from the relevant CAIT data note):
those of the original ecosystem
of forests in many tropical regions)
estimates include the emissions of carbon from wood products (burned, stored in longterm pools, decayed over time)
Also from the CAIT data note: "It is also important to note that the calculated flux of carbon does not explicitly include changes in carbon stocks that may result from various forms of management. Examples of what is not included are agricultural intensification, fertilization, the trend to no-till agriculture, thinning of forests, changes in species or varieties, and other silvicultural practices." And the data note warns that "these estimates of national sources and sinks of carbon from land-use change are uncertain on the order of +/- 150% for large fluxes, and +/- 50 MtC/yr for estimates near zero." So CAIT's land-use estimates are a bit wild. They are, however, the best currently available at a national level. |
| תאריך יצירה | 05/9/07 |
| מקור | self-made using data from the World Resources Institute and a blank map by Canuckguy and others |
| יוצר | Vinny Burgoo |
רישיון

|
מוענקת בכך הרשות להעתיק, להפיץ או לשנות את המסמך הזה, לפי תנאי הרישיון לשימוש חופשי במסמכים של גנו, גרסה 1.2 או כל גרסה מאוחרת יותר שתפורסם על־ידי המוסד לתוכנה חופשית; ללא פרקים קבועים, ללא טקסט עטיפה קדמית וללא טקסט עטיפה אחורית. עותק של הרישיון כלול בפרק שכותרתו הרישיון לשימוש חופשי במסמכים של גנו. |
| הקובץ הזה מתפרסם לפי תנאי רישיון קריאייטיב קומונז ייחוס-שיתוף זהה 3.0 לא מותאם. | ||
| ||
| תבנית רישוי זו הוספה לקובץ כחלק מעדכון רישיון GFDL. |
היסטוריית הקובץ
ניתן ללחוץ על תאריך/שעה כדי לראות את הקובץ כפי שנראה באותו זמן.
| תאריך/שעה | תמונה ממוזערת | ממדים | משתמש | הערה | |
|---|---|---|---|---|---|
| נוכחית | 02:22, 5 בספטמבר 2007 | | 477 × 940 (1.98 מ"ב) | Vinny Burgoo | {{Information |Description='''Cumulative per capita responsibility for anthropogenic CO2''' Data from the World Resources Institute's [http://cait.wri.org/ CAIT 4.0 database] (registration required). Includes CO2 only (not CH4, N20, PFCs, HFCs or SF6). E |
שימוש בקובץ
הדפים הבאים משתמשים בקובץ הזה:
שימוש גלובלי בקובץ
אתרי הוויקי השונים הבאים משתמשים בקובץ זה:
- שימוש באתר ar.wikipedia.org
- שימוש באתר bn.wikipedia.org
- שימוש באתר bs.wikipedia.org
- שימוש באתר ca.wikipedia.org
- שימוש באתר cs.wikipedia.org
- שימוש באתר da.wikipedia.org
- שימוש באתר de.wikipedia.org
- שימוש באתר en.wikipedia.org
- שימוש באתר et.wikipedia.org
- שימוש באתר eu.wikipedia.org
- שימוש באתר fa.wikipedia.org
- שימוש באתר fr.wikipedia.org
- שימוש באתר gu.wikipedia.org
- שימוש באתר ha.wikipedia.org
- שימוש באתר hi.wikipedia.org
- שימוש באתר hy.wikipedia.org
- שימוש באתר mk.wikipedia.org
- שימוש באתר pnb.wikipedia.org
- שימוש באתר pt.wikipedia.org
- שימוש באתר ru.wikipedia.org
- שימוש באתר so.wikipedia.org
- שימוש באתר ta.wikipedia.org
- שימוש באתר th.wikipedia.org
- שימוש באתר uk.wikipedia.org
- שימוש באתר ur.wikipedia.org
- שימוש באתר vi.wikipedia.org
- שימוש באתר zh.wikipedia.org