
קובץ:Vostok Petit data.svg

לקובץ המקורי (קובץ SVG, הגודל המקורי: 1,024 × 768 פיקסלים, גודל הקובץ: 81 ק"ב)
| זהו קובץ שמקורו במיזם ויקישיתוף. תיאורו בדף תיאור הקובץ המקורי (בעברית) מוצג למטה. |
תקציר
| תיאור |
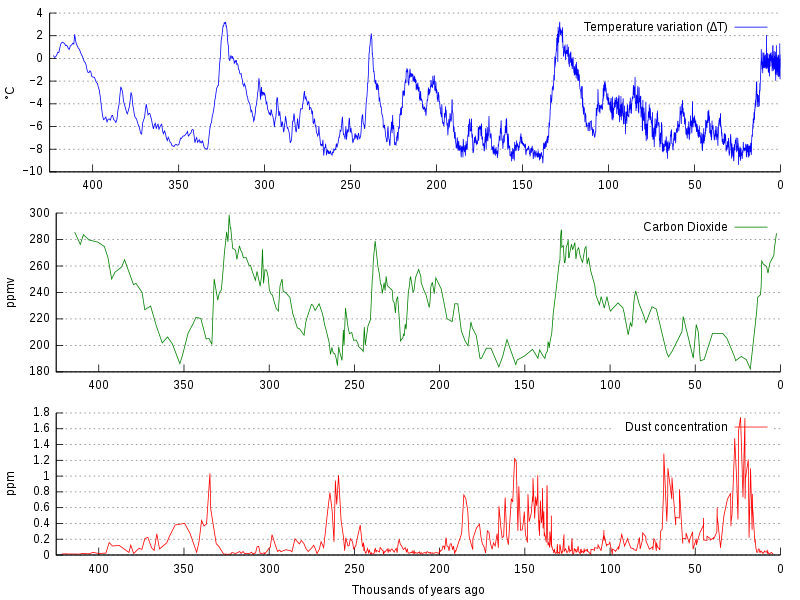
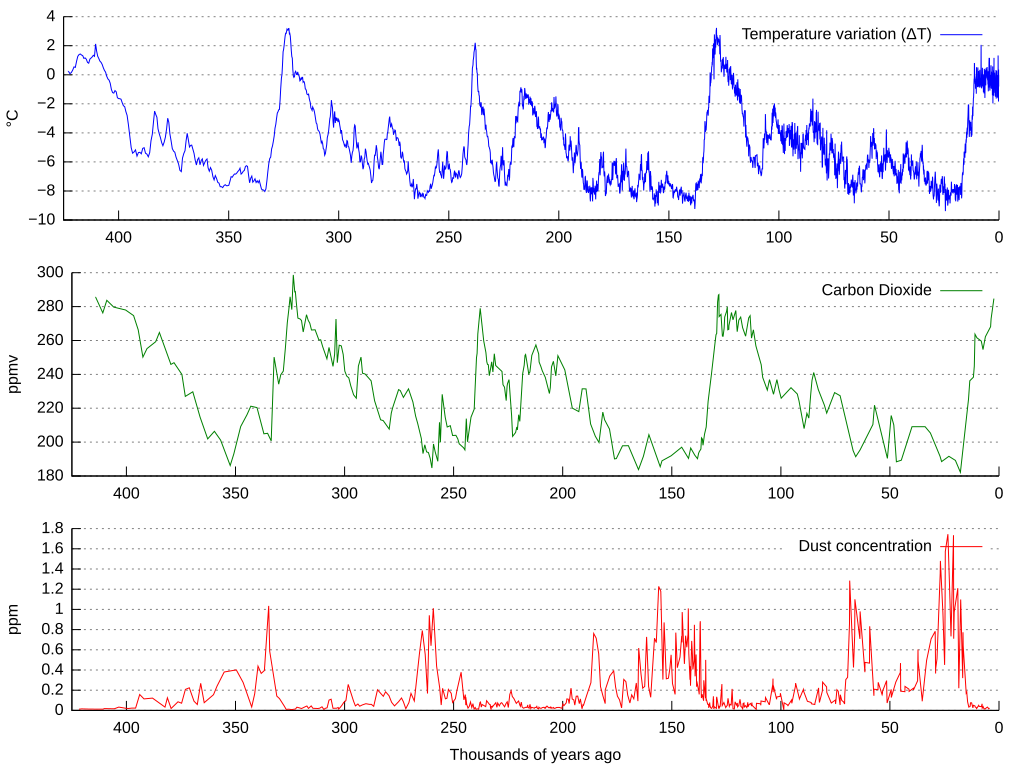
La bildo estas kopiita de wikipedia:en. La originala priskribo estas: Graph of CO2 (Green graph), temperature (Blue graph), and dust concentration (Red graph) measured from the Vostok, Antarctica ice core as reported by Petit et al., 1999. Higher dust levels are believed to be caused by cold, dry periods. The Earth's orbital eccentricity, tilt, and precession vary in a pattern over thousands of years. The IPCC notes that Milankovitch cycles drove the ice age cycles; CO2 followed temperature change "with a lag of some hundreds of years" (visible on a graph more zoomed in than this); and that as a feedback amplified temperature change. Among other factors, CO2 is more soluble in colder than in warmer waters. العربية: مخطّطٌ يُبيّن علاقة ثاني أوكسيد الكاربون ودرجة الحرارة وتركيز الغبار في قالب جليد فوستوك (بالإنجليزيّة: Vostok ice core) خلال 450,000 سنة الماضيّة |
| תאריך יצירה | |
| מקור | נוצר על ידי מעלה היצירה בהתבסס על: Vostok-ice-core-petit.png by NOAA |
| יוצר |
Original: לא ידוע Vector: |
| גרסאות אחרות |
Derivative works of this file: |
| SVGהתפתחות | Gnuplot עם נוצרה ה גרפיקה וקטורית This file is translated using SVG switch elements: all translations are stored in the same file. |
Data sets used are:
- ftp://ftp.ncdc.noaa.gov/pub/data/paleo/icecore/antarctica/vostok/deutnat.txt
- ftp://ftp.ncdc.noaa.gov/pub/data/paleo/icecore/antarctica/vostok/co2nat.txt
- ftp://ftp.ncdc.noaa.gov/pub/data/paleo/icecore/antarctica/vostok/dustnat.txt
קוד מקור
Gnuplot code
unset multiplot
set term svg size 1024,768
set output "vostok-data.svg"

set border 3
set xtics nomirror
set ytics nomirror
unset xlabel
unset ylabel

set grid y
set multiplot layout 3,1

set ylabel "°C"
plot [-425:0] [-10:4] \
        "deutnat.txt" \
        using (-$2/1000):4 \
        title "Temperature variation (ΔT)" \
        ls 3 \
        with lines

set ylabel "ppmv"
plot [-425:0] \
        "co2nat.txt" \
        using (-$1/1000):2 \
        title "Carbon Dioxide" \
        ls 2 \
        with lines

set xlabel "Thousands of years ago"
set ylabel "ppm"
plot [-425:0] \
        "dustnat.txt" \
        using (-$1/1000):2 \
        title "Dust concentration" \
        ls 1 \
        with lines
Explanation
After executing gnuplot, the resulting SVG file was manually changed to
* remove the negative signs for the x axis values
* change the [[:w:hyphen-minus|hyphen-minus]] characters in the temperature axis values to proper minus sign characters
| הקובץ הזה מתפרסם לפי תנאי רישיון קריאייטיב קומונז ייחוס-שיתוף זהה 3.0 לא מותאם. | ||
| ||
| תבנית רישוי זו הוספה לקובץ כחלק מעדכון רישיון GFDL. |

|
מוענקת בכך הרשות להעתיק, להפיץ או לשנות את המסמך הזה, לפי תנאי הרישיון לשימוש חופשי במסמכים של גנו, גרסה 1.2 או כל גרסה מאוחרת יותר שתפורסם על־ידי המוסד לתוכנה חופשית; ללא פרקים קבועים, ללא טקסט עטיפה קדמית וללא טקסט עטיפה אחורית. עותק של הרישיון כלול בפרק שכותרתו הרישיון לשימוש חופשי במסמכים של גנו. |
יומן העלאה מקורי
This image is a derivative work of the following images:
- Vostok-ice-core-petit.png licensed with Cc-by-sa-3.0-migrated, GFDL
- 2006-02-15T20:38:10Z Maksim 598x441 (31557 Bytes) La bildo estas kopiita de wikipedia:en. La originala priskribo estas: Graph of [[carbon dioxide|CO2]], [[temperature]], and dust concentration measured from the [[Vostok, Antarctica]] [[ice core]] as reported by Petit et al.
Uploaded with derivativeFX
היסטוריית הקובץ
ניתן ללחוץ על תאריך/שעה כדי לראות את הקובץ כפי שנראה באותו זמן.
| תאריך/שעה | תמונה ממוזערת | ממדים | משתמש | הערה | |
|---|---|---|---|---|---|
| נוכחית | 16:01, 25 ביוני 2021 | | 768 × 1,024 (81 ק"ב) | Matěj Orlický | File uploaded using svgtranslate tool (https://svgtranslate.toolforge.org/). Added translation for cs. |
| 01:25, 1 בדצמבר 2013 |  | 768 × 1,024 (77 ק"ב) | SeL media | time axis reversed | |
| 20:39, 25 בספטמבר 2011 |  | 768 × 1,024 (309 ק"ב) | Hel-hama | text improved | |
| 06:07, 27 באפריל 2011 |  | 768 × 1,024 (83 ק"ב) | Awickert | Didn't realize that it was a draw-on box instead of a measuring-box. Take 3! | |
| 06:05, 27 באפריל 2011 |  | 768 × 1,024 (83 ק"ב) | Awickert | [Shoot - last time, picked original instead of new version to upload] Manually moved axes in Inkscape such that the three plots line up with one another | |
| 06:02, 27 באפריל 2011 |  | 768 × 1,024 (75 ק"ב) | Awickert | Manually moved axes in Inkscape such that the three plots line up with one another | |
| 16:25, 20 ביוני 2010 |  | 768 × 1,024 (75 ק"ב) | Autopilot | {{Information |Description=La bildo estas kopiita de wikipedia:en. La originala priskribo estas: Graph of CO<sub>2</sub> (Green graph), temperature (Blue graph), and dust concentration (Red graph) measured from the [[Vostok, Antarc |
שימוש בקובץ
הדף הבא משתמש בקובץ הזה:
שימוש גלובלי בקובץ
אתרי הוויקי השונים הבאים משתמשים בקובץ זה:
- שימוש באתר af.wikipedia.org
- שימוש באתר ar.wikipedia.org
- שימוש באתר be.wikipedia.org
- שימוש באתר bg.wikipedia.org
- שימוש באתר ca.wikipedia.org
- שימוש באתר cs.wikipedia.org
- שימוש באתר cy.wikipedia.org
- שימוש באתר da.wikipedia.org
- שימוש באתר de.wikipedia.org
- שימוש באתר en.wikipedia.org
- Climate variability and change
- Global cooling
- Ice core
- Orbital forcing
- Quaternary glaciation
- Carbon dioxide in Earth's atmosphere
- Talk:Ice age/Archive 1
- File talk:Vostok Petit data.svg
- List of periods and events in climate history
- User talk:Jc-S0CO/Archives/2013/2
- User:Mark Buchanan/sandbox/QuatGlac
- User:Mark Buchanan/sandbox/Glaciation-WIP
- Portal:Climate change
- Talk:Climate variability and change/Archive 8
- שימוש באתר en.wikiversity.org
- שימוש באתר es.wikipedia.org
- שימוש באתר eu.wikipedia.org
- שימוש באתר fa.wikipedia.org
- שימוש באתר fi.wikipedia.org
- שימוש באתר fi.wikiversity.org
- שימוש באתר fr.wikipedia.org
- שימוש באתר gl.wikipedia.org
- שימוש באתר ha.wikipedia.org
- שימוש באתר it.wikipedia.org
- שימוש באתר ja.wikipedia.org
- שימוש באתר jv.wikipedia.org