
קובץ:Estradiol during menstrual cycle.png

לקובץ המקורי (3,682 × 1,640 פיקסלים, גודל הקובץ: 492 ק"ב, סוג MIME: image/png)
| זהו קובץ שמקורו במיזם ויקישיתוף. תיאורו בדף תיאור הקובץ המקורי (בעברית) מוצג למטה. |
תקציר
| תיאור |
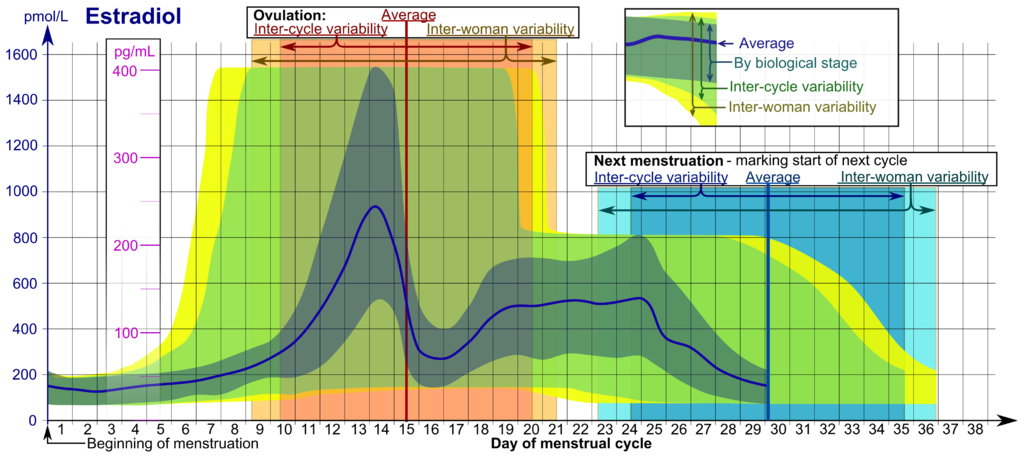
English: Reference ranges for the blood content of estradiol during the menstrual cycle.
InterpretationThe time scale starts with the beginning (or "onset") of (last) menstrual period (LMP), given as day number. Day number 1 corresponds to 0 to 0.99 days from LMP, and Day number 2 corresponds to 1.00 to 1.99 days from LMP and so forth. The time scale ends at whatever is the actual next menstruation, which marks the beginning of the next cycle, which is equivalent to starting all over again from the beginning of the time scale.
Hormone levels represent usual ones, not necessarily related to what is healthy. Hormone ranges vary between cases at the same biological stage of the menstrual cycle. Furthermore, the actual timing (usually given in day numbers from mentruation) of that biological stage varies, both between cycles of any single woman (inter-cycle) and between somen (inter-woman). Therefore, the appropriate ranges to use depend on how certain the actual biological stage can be estimated at any time.
DerivationSee source article:
|
||
| תאריך יצירה | |||
| מקור |
נוצר על־ידי מעלה היצירה.
 |
||
| יוצר |
This image can be cited as:
|
||
| גרסאות אחרות |
|

רישיון
| ברצוני, בעלי זכויות היוצרים על יצירה זו, לשחרר יצירה זו לנחלת הכלל. זה תקף בכל העולם. יש מדינות שבהן הדבר אינו אפשרי על פי חוק, אם כך: אני מעניק לכל אחד את הזכות להשתמש בעבודה זו לכל מטרה שהיא, ללא תנאים כלשהם, אלא אם כן תנאים כאלה נדרשים על פי חוק. |
היסטוריית הקובץ
ניתן ללחוץ על תאריך/שעה כדי לראות את הקובץ כפי שנראה באותו זמן.
| תאריך/שעה | תמונה ממוזערת | ממדים | משתמש | הערה | |
|---|---|---|---|---|---|
| נוכחית | 17:03, 22 בינואר 2011 | | 1,640 × 3,682 (492 ק"ב) | Mikael Häggström | Some fixes |
| 10:23, 22 בינואר 2011 | 1,640 × 4,279 (524 ק"ב) | Mikael Häggström | {{Information |Description={{en|1=Estradiol {{Description of menstrual cycle diagrams}}}} |Source={{own}} |Author=Mikael Häggström |Date=2011-01-22 |Permission= |other_versions= }} |
שימוש בקובץ
הדפים הבאים משתמשים בקובץ הזה:
שימוש גלובלי בקובץ
אתרי הוויקי השונים הבאים משתמשים בקובץ זה:
- שימוש באתר ar.wikipedia.org
- שימוש באתר as.wikipedia.org
- שימוש באתר bs.wikipedia.org
- שימוש באתר de.wikipedia.org
- שימוש באתר en.wikipedia.org
- שימוש באתר en.wikiversity.org
- שימוש באתר es.wikipedia.org
- שימוש באתר gl.wikipedia.org
- שימוש באתר hy.wikipedia.org
- שימוש באתר id.wikipedia.org
- שימוש באתר ml.wikipedia.org
- שימוש באתר pt.wikipedia.org
- שימוש באתר sl.wikipedia.org
- שימוש באתר sr.wikipedia.org
- שימוש באתר sv.wikipedia.org
- שימוש באתר uk.wikipedia.org
- שימוש באתר www.wikidata.org
- שימוש באתר zh.wikipedia.org
- שימוש באתר zh.wikiversity.org