
קובץ:Mandelbrot Creation Animation.gif
Mandelbrot_Creation_Animation.gif (600 × 600 פיקסלים, גודל הקובץ: 1.78 מ"ב, סוג MIME: image/gif, בלולאה, 20 תמונות, 20 שניות)
| זהו קובץ שמקורו במיזם ויקישיתוף. תיאורו בדף תיאור הקובץ המקורי (בעברית) מוצג למטה. |
תקציר
| תיאור |
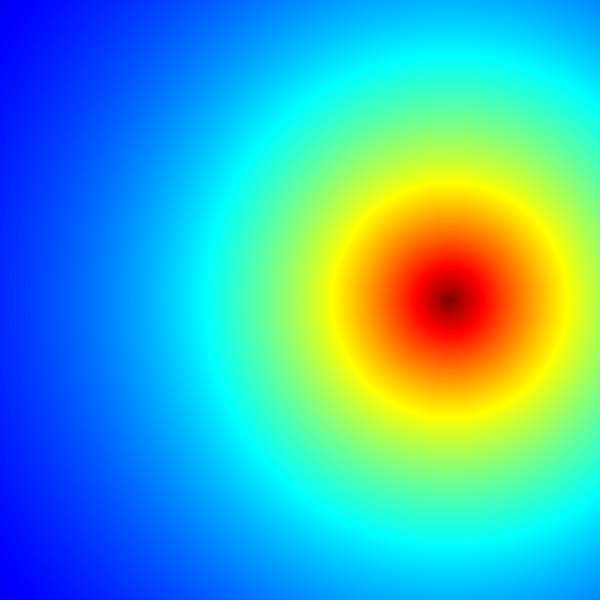
An animated diagram showing iterations of the equation used to generate the Mandelbrot set, a fractal first studied by Benoît Mandelbrot in 1979. The animation shows the values of Z for first 20 iterations of the equation where c is a complex variable. Mandelbrot set graphics are usually generated using the so-called "escape algorithm", where color is assigned according to the number of iterations it took for the equation to diverge past a pre-set limit, and black color is used for regions that never diverge. This, however, is a plot of a much simpler quantity: the actual values of the equation at the first 20 iterations. Every pixel in the image corresponds to a different value of a complex constant c ranging from -2.2 to 1 on the real axis (horizontal) and from -1.2i to 1.2i on the imaginary axis (vertical). Z is initialized to 0. At each iteration, the next value of Z is calculated using the equation above. This graphic was generated with 13 lines of code in the R language (see below for the code). For each point, the magnitude (aka absolute value) of Z is calculated, than scaled using an exponential function to emphasize fine detail, and finally mapped to color palette (jetColors). Dark red is a very low number, dark blue is a very high number. The deep blue region "squeezing" in the boundaries of the fractal is the region where Z value diverges to infinity. |
| תאריך יצירה | |
| מקור | נוצר על־ידי מעלה היצירה |
| יוצר | Jarekt |
| גרסאות אחרות |
Mandelbrot Creation Animation (800x600).gif: .gif) |
| GIFהתפתחות | R עם נוצרה ה GIF תמונת מפת סיביות |
| קוד מקור | R codelibrary(caTools)
jet.colors = colorRampPalette(c("#00007F", "blue", "#007FFF", "cyan", "#7FFF7F", "yellow", "#FF7F00", "red", "#7F0000"))
m = 600
C = complex( real=rep(seq(-1.8,0.6, length.out=m), each=m ),
imag=rep(seq(-1.2,1.2, length.out=m), m ) )
C = matrix(C,m,m)
Z = 0
X = array(0, c(m,m,20))
for (k in 1:20) {
Z = Z^2+C
X[,,k] = exp(-abs(Z))
}
write.gif(X, "Mandelbrot.gif", col=jet.colors, delay=100)
|

רישיון

|
מוענקת בכך הרשות להעתיק, להפיץ או לשנות את המסמך הזה, לפי תנאי הרישיון לשימוש חופשי במסמכים של גנו, גרסה 1.2 או כל גרסה מאוחרת יותר שתפורסם על־ידי המוסד לתוכנה חופשית; ללא פרקים קבועים, ללא טקסט עטיפה קדמית וללא טקסט עטיפה אחורית. עותק של הרישיון כלול בפרק שכותרתו הרישיון לשימוש חופשי במסמכים של גנו. |
- הנכם רשאים:
- לשתף – להעתיק, להפיץ ולהעביר את העבודה
- לערבב בין עבודות – להתאים את העבודה
- תחת התנאים הבאים:
- ייחוס – יש לתת ייחוס הולם, לתת קישור לרישיון, ולציין אם נעשו שינויים. אפשר לעשות את זה בכל צורה סבירה, אבל לא בשום צורה שמשתמע ממנה שמעניק הרישיון תומך בך או בשימוש שלך.
- שיתוף זהה – אם תיצרו רמיקס, תשנו, או תבנו על החומר, חובה עליכם להפיץ את התרומות שלך לפי תנאי רישיון זהה או תואם למקור.
היסטוריית הקובץ
ניתן ללחוץ על תאריך/שעה כדי לראות את הקובץ כפי שנראה באותו זמן.
| תאריך/שעה | תמונה ממוזערת | ממדים | משתמש | הערה | |
|---|---|---|---|---|---|
| נוכחית | 21:32, 13 ביוני 2007 | | 600 × 600 (1.78 מ"ב) | Jarekt | {{Information |Description=Animation GIF file showing iteration of creating Mandelbrot set image |Source=self-made |Date=06/13/2007 |Author= Jarekt }} Image generated using R language and executing the following code: library(caTools) jet |
שימוש בקובץ
![]() אין בוויקיפדיה דפים המשתמשים בקובץ זה.
אין בוויקיפדיה דפים המשתמשים בקובץ זה.
שימוש גלובלי בקובץ
אתרי הוויקי השונים הבאים משתמשים בקובץ זה:
- שימוש באתר cs.wikipedia.org
- שימוש באתר en.wikipedia.org
- שימוש באתר en.wikibooks.org
- שימוש באתר fa.wikipedia.org
- שימוש באתר fi.wikipedia.org
- שימוש באתר hi.wikipedia.org
- שימוש באתר hr.wikipedia.org
- שימוש באתר kn.wikipedia.org
- שימוש באתר mn.wikipedia.org
- שימוש באתר pt.wikipedia.org
- שימוש באתר zh.wikipedia.org