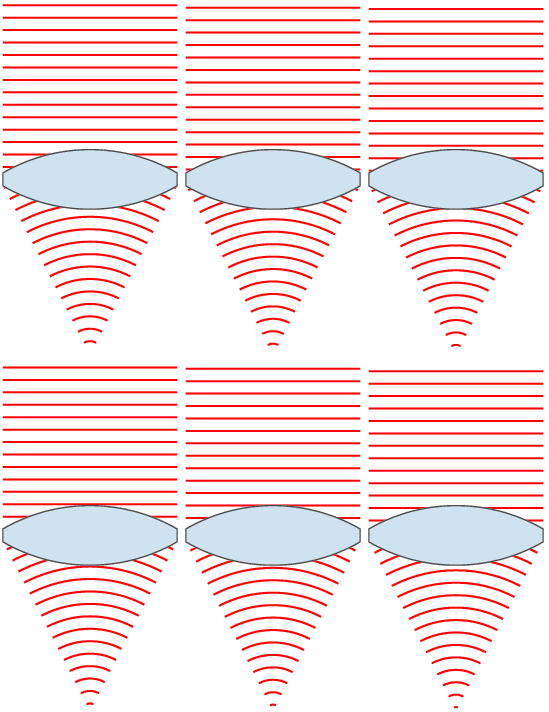
קובץ:Lens and wavefronts.gif

תוכן הדף אינו נתמך בשפות אחרות.
מתוך ויקיפדיה, האנציקלופדיה החופשית

Lens_and_wavefronts.gif(183 × 356 פיקסלים, גודל הקובץ: 35 ק"ב, סוג MIME‏: image/gif, בלולאה, 9 תמונות, 0.7 שניות)

ויקישיתוף זהו קובץ שמקורו במיזם ויקישיתוף. תיאורו בדף תיאור הקובץ המקורי (בעברית) מוצג למטה.

slnglelens

תקציר

תיאור Illustration of wavefronts after passing through a lens. Interestingly, to produce a point source reverse the direction of the waves, with the focus point acting as a point source.
תאריך יצירה (UTC)
מקור self-made with MATLAB
יוצר Oleg Alexandrov
גרסאות אחרות
 
. MATLAB עם‎‎ נוצרה ה GIF תמונת מפת סיביות

רישיון

Public domain ברצוני, בעלי זכויות היוצרים על יצירה זו, לשחרר יצירה זו לנחלת הכלל. זה תקף בכל העולם.
יש מדינות שבהן הדבר אינו אפשרי על פי חוק, אם כך:
אני מעניק לכל אחד את הזכות להשתמש בעבודה זו לכל מטרה שהיא, ללא תנאים כלשהם, אלא אם כן תנאים כאלה נדרשים על פי חוק.

siingleline

% Illustration of planar wavefronts going through a lens and getting focused
% into a converging spherical wave

function main ()

  % lens index
   n=1.5; 

  % number of points, used for plotting
   N = 100;

  % radii of lens surfaces
   R1 = 0.5; 
   R2 = 1.5;

  % centers of circles (y coord is 0)
   O1 = -2.9;
   O2 = -O1;

  % focal length
   f = (n-1)*(1/R1+1/R2); f = 1/f;
   
   % theta0 determines the width of the lens
   theta0=pi/6;
   Theta = linspace(-theta0, theta0, N);

  % right face of the lens
   L1x = R1*cos(Theta)+O1;
   L1y =R1*sin(Theta); 

   % left size of the lens
   L2x=-R2*cos(Theta)+O2;
   L2y = R2*sin(Theta);

   % flat top part
   Topx = [L1x(N), L2x(N)];
   Topy = [L1y(N), L2y(N)];

   % flat bottom part
   Botx = [L1x(1) L2x(1)];
   Boty = [L1y(1), L2y(1)];

   % the lens
   Lensx = [L1x rv_vec(Topx), rv_vec(L2x), Botx];
   Lensy = [L1y rv_vec(Topy), rv_vec(L2y), Boty];

   % Parameters for graphing
   Lens_color  = [204, 226, 239]/256;
   Lens_border = 0.3*[1, 1, 1];
   lbw = 1.3; % lens border width
   wavefr_color = [1, 0, 0];
   wavefr_bdw   = 2;
   
   % spacing between wavefronts (both plane and spherical ones)
   spacing = 0.25;

   % 2*H is the height of the plane wavefronts
   H = L1y(N); 

   % theta2 = slope of the line going from the upper-right
   % end of the lens to the focus point
   theta2 = atan(L1y(N)/(f-L1x(N)));

   % Shape of the spherical wavefronts.
   Theta = linspace(-theta2, theta2, N);
   X = -cos(Theta);
   Y =  sin(Theta);

   S = -f; % start ploting waves from here to the right

   % number of frames in the movie
   num_frames = 10;
   Shifts = linspace(0, spacing, num_frames+1);

   % start at S+shift, plot the wavefronts
   for frame_no = 1:num_frames

      shift = Shifts(frame_no);
      
      s = S+shift;

      % plotting window
      figure(1); clf; hold on; axis equal; axis off;

      % plot the plane wavefronts
      while s < 0
         plot([s, s], [-H, H], 'color', wavefr_color, 'linewidth', wavefr_bdw);
         s = s + spacing;
      end
      
   
      % plot the spherical wavefronts
      s = s - 10*spacing; % backtrack a bit
      while s < f
         
         rho = f-s;
         
         if rho*Y(N) <= L1y(N)
            plot(rho*X+f, rho*Y, 'color', wavefr_color, 'linewidth', wavefr_bdw);
         end
         
         s = s + spacing;
         
      end

      % plot the lens
      fill(Lensx, Lensy, Lens_color, 'EdgeColor', Lens_border, 'LineWidth', lbw);
%      get(H)
%      return
      
      % Invisible points to force MATLAB to keep the
      % plotting window fixed.
      tiny = 0.15*spacing;
      white = 0.999*[1, 1, 1];
      plot(S-tiny,   H+tiny, 'color', white);
      plot(S-tiny,  -H-tiny, 'color', white);
      plot(f+tiny,   H+tiny, 'color', white);
      plot(f+tiny,  -H-tiny, 'color', white);

      % Rotate by 90 degrees
      set(gca, 'View', [90, 90])

      % save current file
      frame_file = sprintf('Frame%d.eps', 1000+frame_no);
      disp(frame_file);
      saveas(gcf, frame_file, 'psc2');
      pause(0.07)
   end

% The frames were converted to a movie with the command
% convert -antialias -loop 10000  -delay 8 -compress LZW Frame100* Lens_and_wavefronts.gif
   
function W = rv_vec(V)

   K = length(V);

   W = V;
   for i=1:K
      W(i) = V(K-i+1);
   end

כיתובים

נא להוסיף משפט שמסביר מה הקובץ מייצג
Siingleline

פריטים שמוצגים בקובץ הזה

מוצג

היסטוריית הקובץ

ניתן ללחוץ על תאריך/שעה כדי לראות את הקובץ כפי שנראה באותו זמן.

תאריך/שעהתמונה ממוזערתממדיםמשתמשהערה
נוכחית09:35, 25 בנובמבר 2007תמונה ממוזערת לגרסה מ־09:35, 25 בנובמבר 2007‪356 × 183‬ (35 ק"ב)Oleg Alexandrovtweak
07:10, 24 בנובמבר 2007תמונה ממוזערת לגרסה מ־07:10, 24 בנובמבר 2007‪356 × 171‬ (33 ק"ב)Oleg Alexandrovtweak
07:09, 24 בנובמבר 2007תמונה ממוזערת לגרסה מ־07:09, 24 בנובמבר 2007‪356 × 171‬ (33 ק"ב)Oleg Alexandrovtweak
03:56, 24 בנובמבר 2007תמונה ממוזערת לגרסה מ־03:56, 24 בנובמבר 2007‪359 × 171‬ (33 ק"ב)Oleg Alexandrovtweak, same license
03:53, 24 בנובמבר 2007תמונה ממוזערת לגרסה מ־03:53, 24 בנובמבר 2007‪359 × 171‬ (32 ק"ב)Oleg Alexandrovtweak
03:49, 24 בנובמבר 2007תמונה ממוזערת לגרסה מ־03:49, 24 בנובמבר 2007‪359 × 151‬ (31 ק"ב)Oleg Alexandrov{{Information |Description=Illustration of wavefronts after passing through a [:en:lens (optics)|lens]] |Source=self-made with MATLAB |Date=~~~~~ |Author= Oleg Alexandrov |Permission=see below |other_versions= }}

הדפים הבאים משתמשים בקובץ הזה:

שימוש גלובלי בקובץ

אתרי הוויקי השונים הבאים משתמשים בקובץ זה:

צפו בשימושים בקובץ זה במיזמי ויקימדיה נוספים.