
קובץ:Butterworth filter bode plot.png

גודל התצוגה המקדימה הזאת: 800 × 560 פיקסלים. רזולוציות אחרות: 320 × 224 פיקסלים | 640 × 448 פיקסלים | 1,024 × 717 פיקסלים | 1,250 × 875 פיקסלים.
לקובץ המקורי (1,250 × 875 פיקסלים, גודל הקובץ: 110 ק"ב, סוג MIME: image/png)
| זהו קובץ שמקורו במיזם ויקישיתוף. תיאורו בדף תיאור הקובץ המקורי (בעברית) מוצג למטה. |
תקציר
| תיאור |
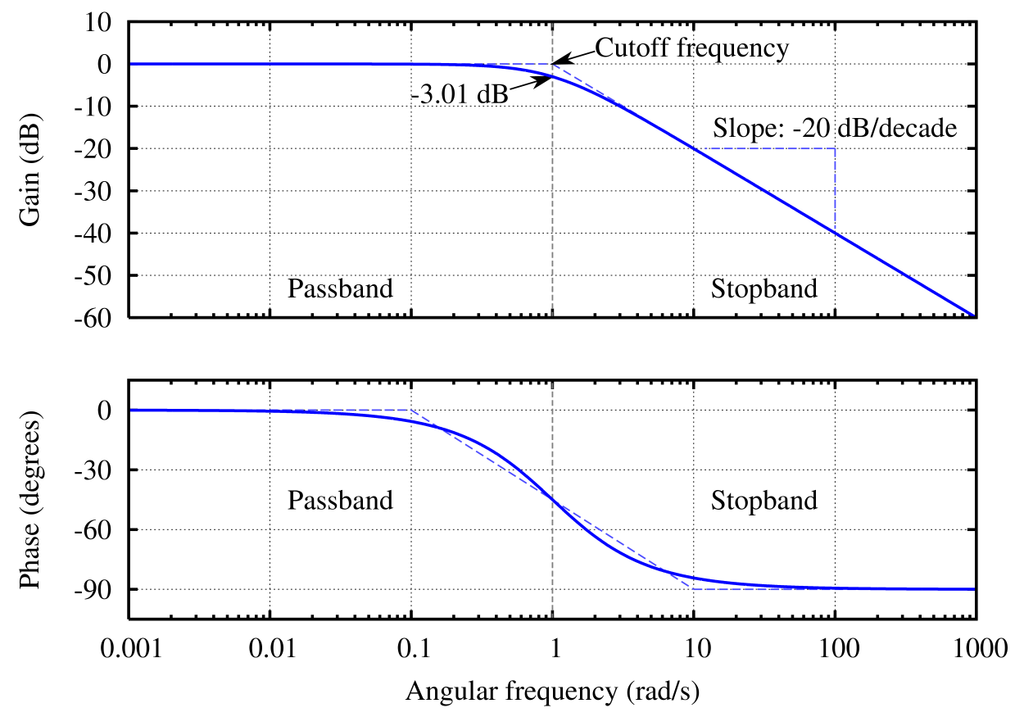
English: The Bode plot of a Butterworth filter with logarithmic axes and various labels. Cutoff frequency is normalized to 1 rad/s. Gain is normalized to 0 dB in the passband. Phase is in degrees because that's typical. The code is kind of kludgy, but makes a good output. See Wikipedia graph-making tips. Generated in gnuplot with the script below (save as butterworth_bode_plot.plt and then open in gnuplot). Then I opened the butterworth_bode_plot.ps file in a text editor to edit the line colors and linestyles, as per this description. This avoids needing to open in proprietary software, and really isn't that difficult (especially if you don't know the commands in the proprietary software either). ;-) Identify the lines easily by their color (the arrow is currently magenta and I want it to be black. Ah, there is the entry with 1 0 1, red + blue = magenta) or by using the gnuplot linestyle−1. (For instance, gnuplot's linestyle 3 corresponds to the ps file's /LT2.) Then you can edit the colors and dashes by hand. I changed the original: /LT0 { PL [] 1 0 0 DL } def
/LT1 { PL [4 dl 2 dl] 0 1 0 DL } def
/LT2 { PL [2 dl 3 dl] 0 0 1 DL } def
/LT3 { PL [1 dl 1.5 dl] 1 0 1 DL } def
into this: /LT0 { PL [] 0 0 1 DL } def
/LT1 { PL [4 dl 2 dl] 0.5 0.5 0.5 DL } def
/LT2 { PL [6 dl 3 dl] 0.3 0.3 1 DL } def
/LT3 { PL [] 0 0 0 DL } def
/LT4–/LT8 I left unchanged. (I don't know what they're used for anyway.) /LTw, /LTb, and /LTa are for the grid lines and such. To convert the PostScript file to PNG:
. Gnuplot עם נוצרה ה PNG תמונת מפת סיביות |
| תאריך יצירה | 8 באוקטובר 2005 (תאריך העלאה) |
| מקור | נוצר על־ידי מעלה היצירה |
| יוצר | Omegatron |
| גרסאות אחרות |
[]
.png:
|
| gnuplot source | click to expand
set samples 2001
set terminal postscript enhanced landscape color lw 2 "Times-Roman" 20
set output "butterworth bode plot.ps"

# Butterworth amplitude response and decibel calculation.  n is the order, which is just 1 in this image.
G(w,n) = 1 / (sqrt(1 + w**(2*n)))
dB(x) = 20 * log10(abs(x))
# Phase is for first order
P(w) = -pi/2-atan(1.2*w)-atan(0.09*w)

# Gridlines
set grid

# Set x axis to logarithmic scale
set logscale x 10

# No need for a key
set nokey #0.1,-25

# Frequency response's line plotting style
set style line 1 lt 1 lw 2

# Asymptote lines and slope lines are the same "arrow" style
set style line 3 lt 3 lw 1
set style arrow 3 nohead ls 3

# -3 dB arrow style
set style line 4 lt 4 lw 1
set style arrow 4 head filled size screen 0.02,15,45 ls 4

# Separator between passband and stopband line style
set style line 2 lt 2 lw 1
set style arrow 2 nohead ls 2

set multiplot

# Magnitude response
# =============================================
set size 1,0.5
set origin 0,0.5

# Set range of x and y axes
set xrange [0.001:1000]
set yrange [-60:10]

# Create x-axis tic marks once per decade (every multiple of 10)
set xtics 10
#set ytics 10

# No need for two sets of numbers
set format x ""

# Use 10 x-axis minor divisions per major division
set mxtics 10

# Axis labels
set ylabel "Gain (dB)"

# Draw asymptote lines
set arrow 1 from 1,0 to 1000,-60 as 3
set arrow 2 from .001,0 to 1,0 as 3

# -3 dB arrow
set arrow 4 from 2,3 to 1,0 as 4

# "Cutoff frequency" label uses same coordinates as the function
set label 3 "Cutoff frequency" at 2,4 l

# "-3 dB" label
set arrow 5 from 0.5,-6 to 1,-3 as 4
set label 4 "-3.01 dB" at 0.5,-7 r

# Draw a separator between passband and stopband and label them
set arrow 3 from 1,-60 to 1,10 as 2

# Label coordinates are relative to the graph window, not to the function, centered at the 1/4 and 3/4 width points
set label 1 "Passband" at graph 0.25, graph 0.1 c
set label 2 "Stopband" at graph 0.75, graph 0.1 c

# Draw slope lines and label
set arrow 6 from 100,-20 to 12,-20 as 3
set arrow 7 from 100,-20 to 100,-39 as 3
set label 5 "Slope: -20 dB/decade" at 100,-15 c

plot dB(G(x,1)) ls 1  title "1st-order response"

#Phase response
# =============================================
set size 1,0.5
set origin 0,0

# Set range of x and y axes
set yrange [-105:15]

# Create y-axis tic marks every 15 degrees
set ytics 30

# Regular numbers
set format x "% g"

# Axis labels
set ylabel "Phase (degrees)"
set xlabel "Angular frequency (rad/s)"

# Draw asymptote lines
set arrow 1 from 0.1,0 to 10,-90 as 3
set arrow 2 from 0.001,0 to 0.1,0 as 3
set arrow 10 from 10,-90 to 1000,-90 as 3

# -3 dB arrow
unset arrow 4 #from 2,3 to 1,0 as 4

# "Cutoff frequency" label uses same coordinates as the function
unset label 3 #"Cutoff frequency" at 2,4 l

# "-3 dB" label
unset arrow 5 #from 0.5,-6 to 1,-3 as 4
unset label 4 #"-3.01 dB" at 0.5,-7 r

# Draw a separator between passband and stopband and label them
set arrow 3 from 1,-105 to 1,15 as 2

# Label coordinates are relative to the graph window, not to the function, centered at the 1/4 and 3/4 width points
set label 1 "Passband" at graph 0.25, graph 0.5 c
set label 2 "Stopband" at graph 0.75, graph 0.5 c

# Draw slope lines and label
unset arrow 6 #from 100,-20 to 12,-20 as 3
unset arrow 7 #from 100,-20 to 100,-39 as 3
unset label 5 #"Slope: -20 dB/decade" at 100,-18 c

plot P(x) ls 1 title "Phase response"

unset multiplot
|


|
קיימת תמונה חדשה תמונה זו בגרסה וקטורית בפורמט "SVG". יש להחליף את התמונה הנוכחית בתמונה החדשה.
File:Butterworth filter bode plot.png → File:Butterworth filter bode plot.svg
למידע נוסף אודות גרפיקה וקטורית, אנא קראו אודות המעבר של ויקישיתוף לתמונות בפורמט SVG. ראו גם מידע אודות התמידה של מדיה-ויקי בתמונות בפורמט SVG. |
 |
רישיון
אני, בעל זכויות היוצרים על היצירה הזאת, מפרסם אותה בזאת תחת הרישיונות הבאים:
הקובץ הזה מתפרסם לפי תנאי רישיונות קריאייטיב קומונז ייחוס-שיתוף זהה 3.0 לא מותאם, 2.5 כללי, 2.0 כללי ו־1.0 כללי.
- הנכם רשאים:
- לשתף – להעתיק, להפיץ ולהעביר את העבודה
- לערבב בין עבודות – להתאים את העבודה
- תחת התנאים הבאים:
- ייחוס – יש לתת ייחוס הולם, לתת קישור לרישיון, ולציין אם נעשו שינויים. אפשר לעשות את זה בכל צורה סבירה, אבל לא בשום צורה שמשתמע ממנה שמעניק הרישיון תומך בך או בשימוש שלך.
- שיתוף זהה – אם תיצרו רמיקס, תשנו, או תבנו על החומר, חובה עליכם להפיץ את התרומות שלך לפי תנאי רישיון זהה או תואם למקור.

|
מוענקת בכך הרשות להעתיק, להפיץ או לשנות את המסמך הזה, לפי תנאי הרישיון לשימוש חופשי במסמכים של גנו, גרסה 1.2 או כל גרסה מאוחרת יותר שתפורסם על־ידי המוסד לתוכנה חופשית; ללא פרקים קבועים, ללא טקסט עטיפה קדמית וללא טקסט עטיפה אחורית. עותק של הרישיון כלול בפרק שכותרתו הרישיון לשימוש חופשי במסמכים של גנו. |
הנכם מוזמנים לבחור את הרישיון הרצוי בעיניכם.
היסטוריית הקובץ
ניתן ללחוץ על תאריך/שעה כדי לראות את הקובץ כפי שנראה באותו זמן.
| תאריך/שעה | תמונה ממוזערת | ממדים | משתמש | הערה | |
|---|---|---|---|---|---|
| נוכחית | 23:01, 8 באוקטובר 2005 | | 875 × 1,250 (110 ק"ב) | Omegatron | last revision? |
| 22:41, 8 באוקטובר 2005 |  | 875 × 1,250 (113 ק"ב) | Omegatron | better | |
| 22:30, 8 באוקטובר 2005 |  | 875 × 1,250 (117 ק"ב) | Omegatron | The frequency response of a Butterworth filter with logarithmic axes (Bode plot) and various labels. Cutoff frequency is normalized to 1 rad/s. Gain is |
שימוש בקובץ
הדף הבא משתמש בקובץ הזה:
שימוש גלובלי בקובץ
אתרי הוויקי השונים הבאים משתמשים בקובץ זה:
- שימוש באתר eo.wikipedia.org
- שימוש באתר eu.wikipedia.org
- שימוש באתר fr.wikipedia.org
- שימוש באתר hi.wikipedia.org
- שימוש באתר nn.wikipedia.org
- שימוש באתר pl.wikipedia.org
- שימוש באתר pt.wikipedia.org
- שימוש באתר zh.wikipedia.org