
קובץ:Beta distribution pdf.svg

גודל התצוגה המקדימה הזאת מסוג PNG של קובץ ה־SVG הזה: 531 × 425 פיקסלים. רזולוציות אחרות: 300 × 240 פיקסלים | 600 × 480 פיקסלים | 960 × 768 פיקסלים | 1,280 × 1,024 פיקסלים | 2,559 × 2,048 פיקסלים.
לקובץ המקורי (קובץ SVG, הגודל המקורי: 531 × 425 פיקסלים, גודל הקובץ: 80 ק"ב)
| זהו קובץ שמקורו במיזם ויקישיתוף. תיאורו בדף תיאור הקובץ המקורי (בעברית) מוצג למטה. |
תקציר
| תיאור |
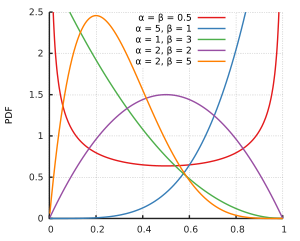
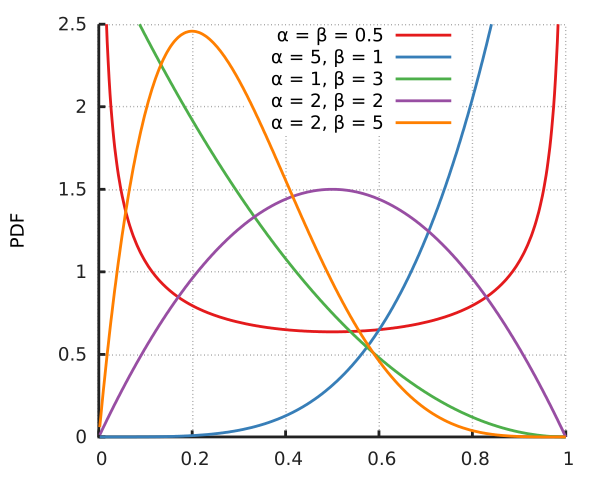
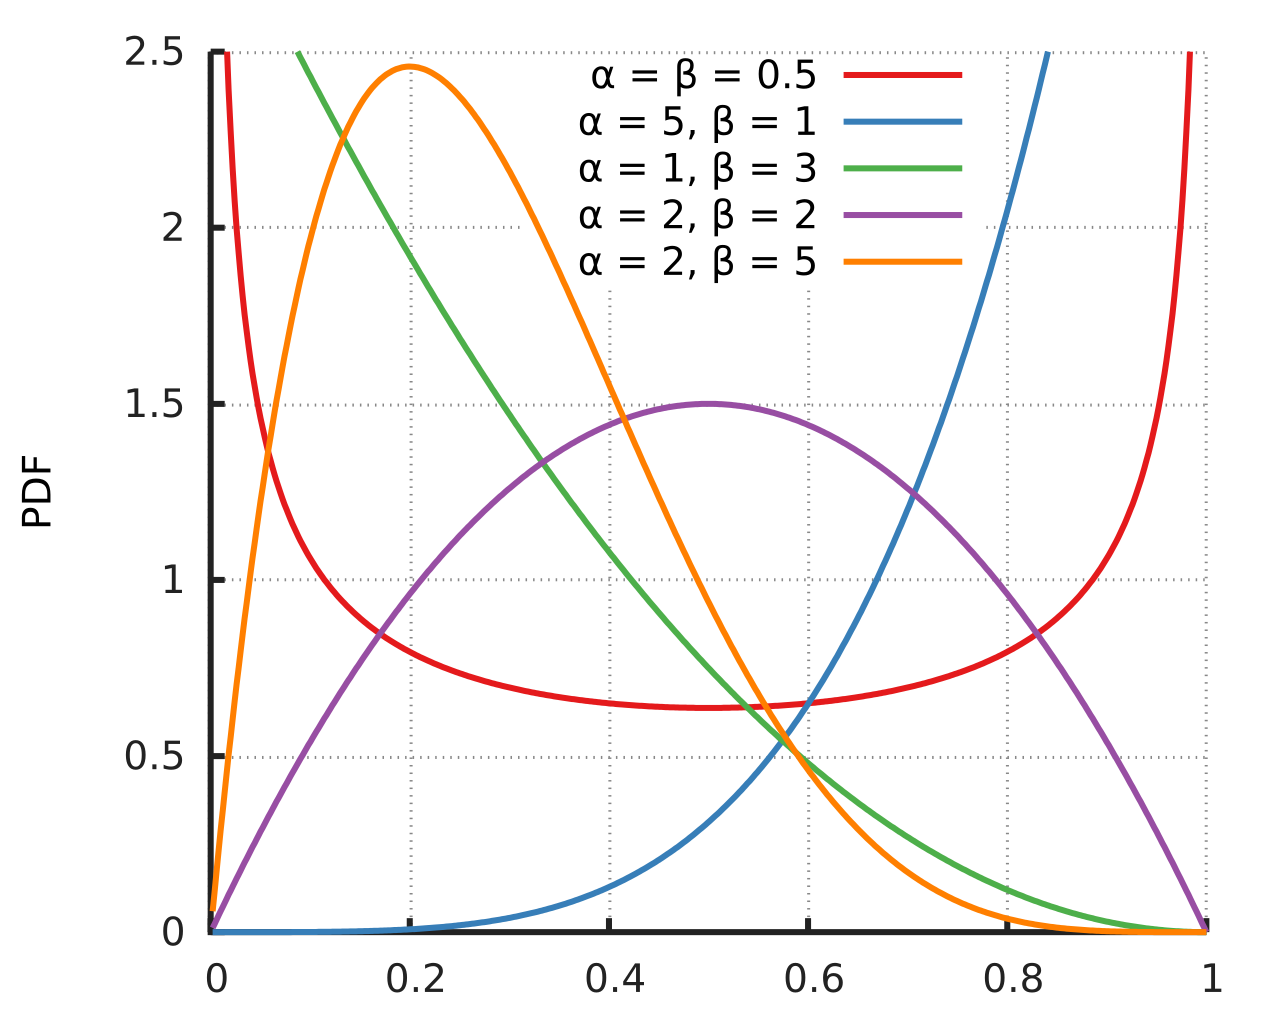
English: Probability density function for the Beta distribution. Created using Gnuplot. |
||||
| תאריך יצירה | |||||
| מקור | נוצר על־ידי מעלה היצירה | ||||
| יוצר | Horas based on the work of Krishnavedala | ||||
| גרסאות אחרות | File:Beta_distribution_pdf.png | ||||
| SVGהתפתחות | |||||
| קוד מקור | Gnuplot code
Data
|
רישיון
| קובץ זה נטול זכויות יוצרים ולפיכך ברשות הציבור. יצירה מורכבת כולה, מיֶדַע שהוא נחלת הכלל, ואין לה מרכיב יצירתי מקורי. |
היסטוריית הקובץ
ניתן ללחוץ על תאריך/שעה כדי לראות את הקובץ כפי שנראה באותו זמן.
| תאריך/שעה | תמונה ממוזערת | ממדים | משתמש | הערה | |
|---|---|---|---|---|---|
| נוכחית | 16:10, 14 בנובמבר 2014 | | 425 × 531 (80 ק"ב) | Horas | {{Information |Description={{en|1=Probability density function for the Beta distribution. Created using the following code: reset reset session out=2 outputpath= "./" outputfilename="betadistribution" if(out==1) {... |
| 00:45, 5 ביוני 2011 |  | 489 × 639 (68 ק"ב) | Krishnavedala | {{Information |Description ={{en|1=Probability density function for the Beta distribution. Created using python with matplotlib, scipy and numpy toolboxes. <syntaxhighlight lang=" |
שימוש בקובץ
הדף הבא משתמש בקובץ הזה:
שימוש גלובלי בקובץ
אתרי הוויקי השונים הבאים משתמשים בקובץ זה:
- שימוש באתר be.wikipedia.org
- שימוש באתר ca.wikipedia.org
- שימוש באתר de.wikipedia.org
- שימוש באתר en.wikipedia.org
- שימוש באתר en.wikibooks.org
- שימוש באתר en.wiktionary.org
- שימוש באתר fi.wikipedia.org
- שימוש באתר it.wikipedia.org
- שימוש באתר ja.wikipedia.org
- שימוש באתר ko.wikipedia.org
- שימוש באתר pt.wikipedia.org
- שימוש באתר tl.wikipedia.org
- שימוש באתר tr.wikipedia.org
- שימוש באתר uk.wikipedia.org
- שימוש באתר zh.wikipedia.org